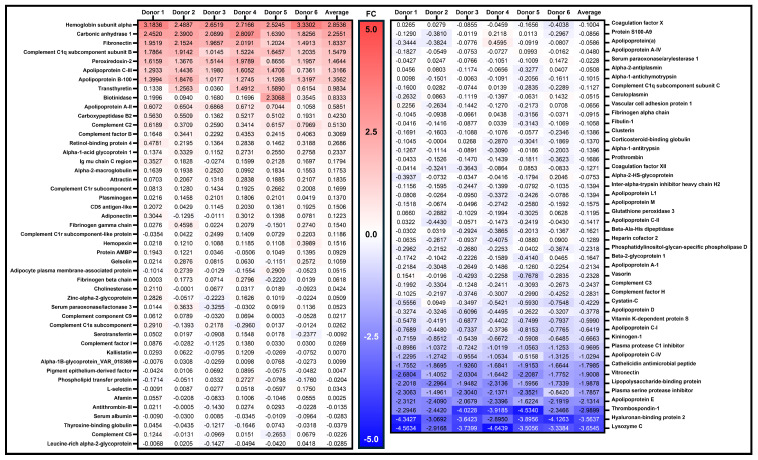
Figure 6.
Heat map of normalized inter-donor protein abundance changes. The ratio of BCD/neat protein measurements across all six donors. Proteins highlighted in blue or red show a higher fold change in the BCD or in the neat preparations, respectively. The data were normalized to total protein content as previously described. FC, fold change.

