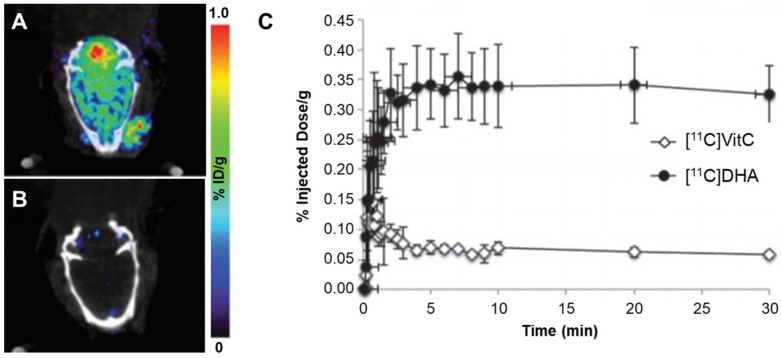
Figure 10.
Representative PET images of [11C]DHA and [11C]VitC. (A) Oxidized form of [11C]VitC ([11C]DHA) and (B) [11C]VitC in a normal rat brain; (C) time-activity curve of the brain region of interest (ROI) data for dynamic scans. PET, positron emission tomography; DHA, dehydroascorbic acid Reproduced from [21], copyright © 2016, Chemical Communications.

