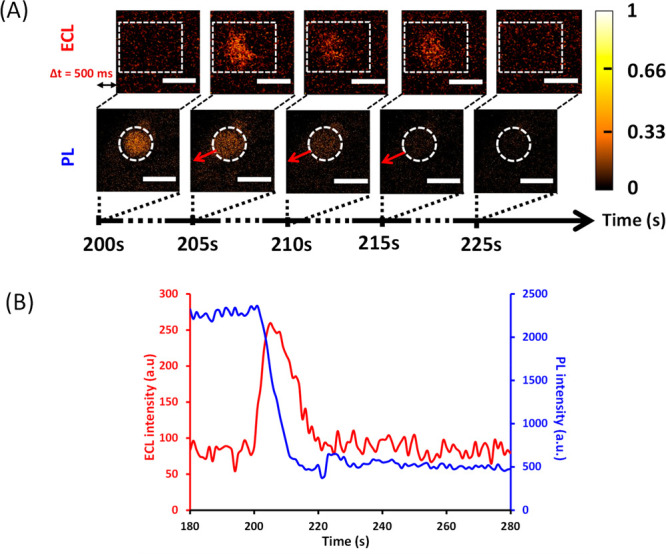
Figure 3.

(A) Parallel time-lapse imaging by ECL (top) and PL (below) showing the permeation by 1 μM melittin of a DOPG/DOPC liposome (the one isolated in the dotted white circle). The liposome lies on a polarized ITO electrode (+1.2 V vs Ag/AgCl) coated with poly-l-lysine. It initially contains both 250 μM [Ru(bpy)3]2+ and 100 mM TPrA. Note that ECL and PL images have a short difference in initial acquisition time (Δt = 500 ms) to avoid overlap between the two types of visual information. During ECL and PL imaging, the focus was on the surface of the ITO electrode. Scale bar: 100 μm. (B) Evolution of PL (blue curve) and ECL (red curve) signals obtained as a function of time for a single liposome [shown in (A)] permeabilized by melittin. PL and ECL intensities were measured from a typical ROI outlined by the dashed white zones shown in (A). Melittin was added at t = 0 s.
