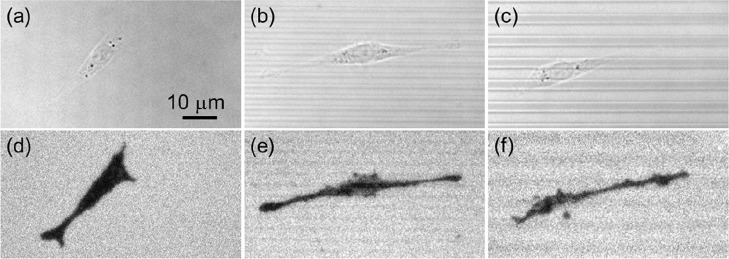
Figure 2.
BF (a–c) and corresponding ECL images (d–f) of PC12 cells on the surface of flat (a, d), MG3 (b, e), and MG6 (c, f) electrodes. The scale bar is 10 μm. ECL images were recorded in 0.01 M PBS (pH 7.4) containing 100 μM Ru(bpy)32+ as luminophore and 25 mM HEPES as coreactant. A constant voltage of +1.3 V (vs Ag/AgCl) was applied.

