Figure 4.
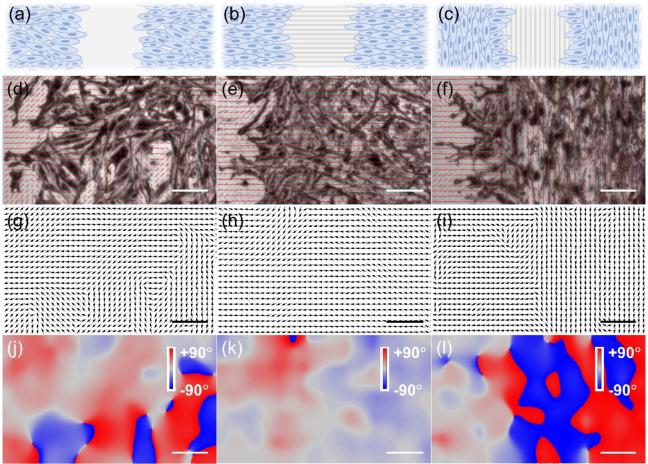
(a–c) Schematic illustration of the orientation of the wound relative to electrode topographical features. (d–f) ECL images of the monolayer of PC12 cells captured after migration for 4 h. Red short lines overlaid in ECL images show local orientations of cells, which are also shown as black arrows (g–l) and color code graphs (j–l). The left panel (d, g, j) is obtained on the flat electrode, the middle panel (e, h, k) represents the case where the orientation of the wound is perpendicular to grooves, and the right panel (f, i, l) stands for the condition in which the orientation of the wound is parallel to grooves. The scale bar in all graphs is 50 μm.

