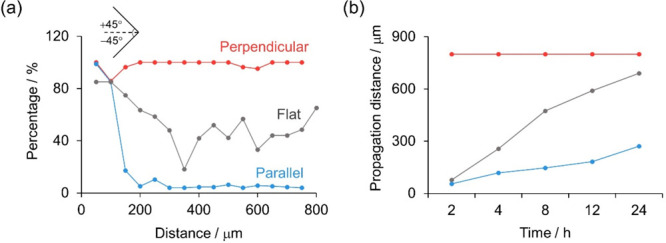
Figure 5.

(a) Quantification of the percentage of cells that have preferential orientations toward the scratch as a function of distance from the leading edge of cell sheet after migration for 4 h. Orientations ranging from −45 to +45° are considered as preferential orientations. The percentage of preferential orientations at other times is displayed in Figure S9. (b) Time evolution of propagation distance from the leading edge of cells on flat electrodes (gray line) and cells under perpendicular (red line) and parallel (blue line) conditions. The propagation distances are quantified as the distance at which the curves in (a) and in Figure S9 reach 60%.
