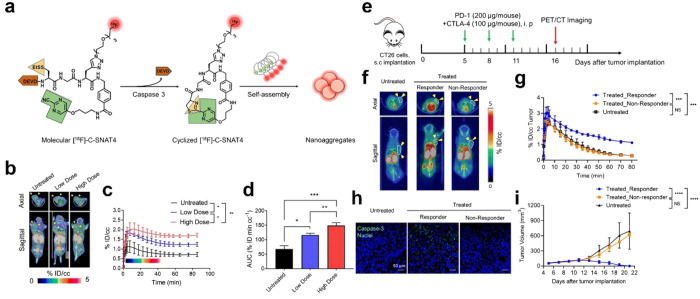
Figure 11.
(a) The chemical structure of [18F]-C-SNAT4 and proposed caspase-3/7 and reduction-controlled conversion of molecular C-SNAT4 into cyclized [18F]-C-SNAT4 through the caspase-3-targeted enable in situ ligand aggregation, followed by self-assembly into nanoaggregates. Green, the pyrimidine nitrile group; yellow, thiol groups of d-cysteine; brown, the capping peptide residues; red, radiolabel 18F. (b) Representative 55 to 60 min axial and sagittal PET/CT images. Nude mice received 7.4 MBq (200 μCi) of [18F]-C-SNAT4 via intravenous injections. Yellow arrowheads indicate the tumors identified from the CT images. NCI-H460 tumor-bearing mice were imaged at 24 h following the last dose of cisplatin treatment (low dose, 3 mg kg–1; high dose, 9 mg kg–1 every other day for three times). (c) Time–activity curve (TAC) of [18F]-C-SNAT4 in untreated and drug-treated tumors. Data are mean ± SD, *P < 0.05, **P < 0.01 (general linear repeated measures), n = 4 per group. (d) The area under the curve (AUC) is shown from t = 0 to 85 min for TAC in (c). Data are mean ± SD, *P < 0.05, **P < 0.01, ***P < 0.001 (ANOVA), n = 4 per group. (e) Treatment and imaging timeline in BALB/c mice bearing CT26 tumors. Mice were intraperitoneally injected with 200 μg of PD-1 and 100 μg of CTLA-4 on days 5, 8, and 11 post-CT26 tumor implantation, and PET images were acquired on day 16 post-tumor implantation. (f) Representative axial and sagittal PET images were acquired at 60 min postinjection of [18F]-C-SNAT4. Yellow arrowheads indicate the tumors identified from the CT images. (g) Time–activity curve (TAC) for dynamic update of [18F]-C-SNAT4 in CT26 tumors. Data are mean ± SD, ***P < 0.001 (general linear model repeated measures), n = 4 for each group. (h) Ex vivo evaluation of caspase-3 activity by immunofluorescence. Tissue sections are shown at 20× objective. Nuclei = blue, caspase-3 = green; scale bars: 50 μm. (i) Caliper measurements of CT26 tumor volumes in untreated or treated mice. Measurements were recorded over 21 days after tumor implantation. Data are mean ± SD, ****P < 0.0001 (general linear model repeated measures). NS = not statistically significant. n = 5 for each group. Reproduced with permission from ref (94). Copyright 2021 Springer Nature.

