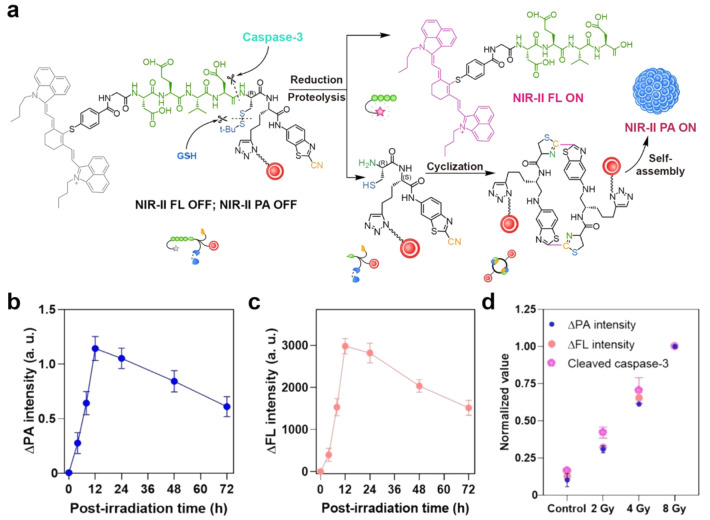
Figure 14.
(a) Schematic illustration of caspase-3-mediated release of NIR-II fluorescent (FL) molecule IR-1048 and self-assembly of nanogapped gold nanoparticles (AuNNPs) accompanied by the “turn-on” of FL and photoacoustic (PA) signals. Corresponding imaging ΔPA (b) and ΔFL (c) signals variation curve. (d) Correlation mechanism between the cleaved caspase-3 enzyme expression and the corresponding activated ΔFL (Ex, 808 nm; Em, 1150 nm) or ΔPA intensity (1250 nm), taken at 12 h after X-ray irradiation with different doses. Reproduced with permission from ref (101). Copyright 2021 Wiley-VCH GmbH.

