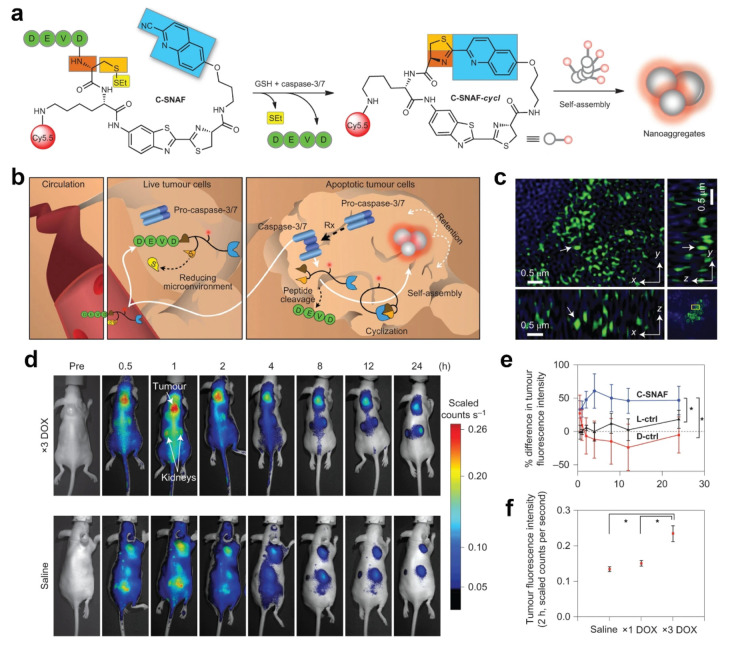
Figure 5.
(a) Proposed caspase-3/7 and reduction-controlled conversion of C-SNAF into C-SNAF-cycl through the bioorthogonal intramolecular cyclization reaction followed by self-assembly into nanoaggregates in situ. Blue, the CHQ group; dark and light orange, amino and thiol groups of d-cysteine, respectively; yellow, thioethyl masking group; green, the capping peptide residues; red, NIR fluorophore Cy5.5. (b) The fate of C-SNAFin vivo is dependent on the tumor response to chemotherapy (Rx). After intravenous administration, C-SNAF extravasates into tumor tissue because of its small size. In live tumor tissue that does not respond to applied chemotherapy, the pro-caspase-3 is inactive, and the DEVD capping peptide remains intact. C-SNAF can diffuse away freely from live tumor tissue, which leads to low fluorescence. In apoptotic tumor tissue, pro-caspase-3 is converted into active caspase-3, and C-SNAF can enter cells readily because of the compromised membrane integrity associated with apoptosis. After DEVD cleavage by active caspase-3 and disulfide reduction, C-SNAF undergoes macrocyclization and in situ nanoaggregation, which leads to enhanced probe retention and high fluorescence. (c) Enlarged 3D-SIM images in a 3D slice of tumor tissues. Arrows show the same fluorescent dots observed in xy, yz, and xz panels. (d) Longitudinal fluorescence imaging with C-SNAF (5 nmol) of ×3 DOX-treated (top) and saline-treated (bottom) tumor-bearing mice. Anatomical locations of the tumor and kidneys are indicated by white arrows. Mice that carry subcutaneous HeLa tumors received either iv chemotherapy of 8 mg kg–1 of DOX or saline once every 4 days for a total of three times. Two days after the final treatment, C-SNAF (5 nmol) in saline was administered iv, and whole-body fluorescence was monitored longitudinally using a Maestro fluorescence imager. (e) The percent difference in tumor fluorescence intensity between ×3 DOX and saline treatment groups over the course of imaging for C-SNAF (blue, n = 5), L-ctrl (black, n = 5), and D-ctrl (red, n = 5). *P < 0.05 between groups indicated by brackets. (f) A comparison of the average tumor fluorescence intensity at 2 h after C-SNAF administration in saline-treated mice (n = 4) or after a ×1 DOX or ×3 DOX treatments in the same animals (n = 4). *P < 0.05 between groups indicated by brackets. All the error bars indicate standard deviation. Reproduced with permission from ref (57). Copyright 2014 Springer Nature.

