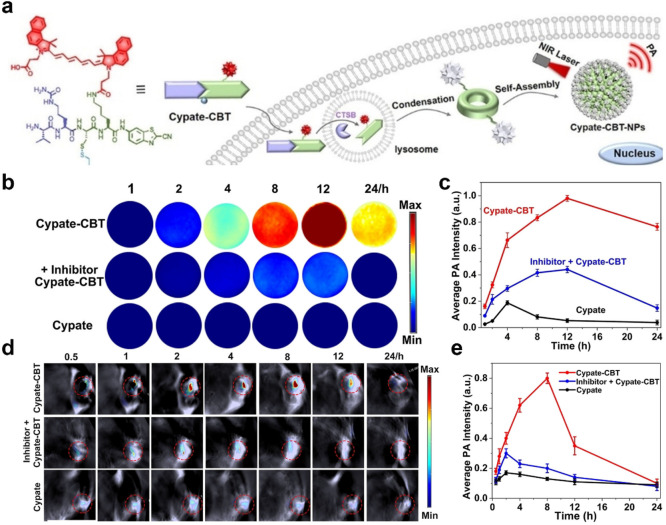
Figure 6.
(a) CTSB-triggered self-assembly of Cypate-CBT-NPs for PA imaging of CTSB activity in vitro and in vivo. (b) First row: PA images of MDA-MB-231 cells incubated with 20 μM Cypate-CBT for 1, 2, 4, 8, 12, or 24 h, respectively. Middle row: preincubated with 150 μM CA-074-Me for 2 h, then followed by 20 μM Cypate-CBT for 1, 2, 4, 8, 12, or 24 h, respectively. Bottom row: incubated with Cypate for 1, 2, 4, 8, 12, or 24 h, respectively. MDA-MB-231 cells were detached from culture dishes with trypsin digestion solution after respective incubation and suspended in a serum-free medium with 0.5 wt % agarose gel for detection. (c) Quantified PA intensity of (b). The error bars represent the standard deviation from three separate measurements. Wavelength: 800 nm. (d) Time course PA images of nude mice bearing a MDA-MB-231 tumor after the intratumoral injection of 40 μL of 200 μM Cypate-CBT (the first row); intratumoral injection of 20 μL of 40 mM CA-074-Me, followed by 40 μL of 200 μM Cypate-CBT 0.5 h later (the middle row); intratumoral injection of 40 μL of 200 μM Cypate (the bottom row). The images were acquired at 0.5, 1, 2, 4, 8, 12, or 24 h. (e) Average PA intensity in (d). The error bars represent the standard deviation from three separate measurements. Wavelength: 800 nm. Reproduced with permission from ref (70). Copyright 2021 Wiley-VCH GmbH.

