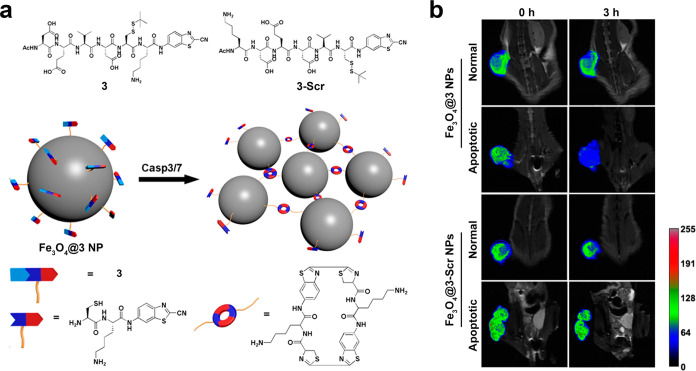
Figure 9.
(a) Chemical structures of 3 and 3-Scr and schematic illustration of intracellular caspase-3/7-instructed aggregation of Fe3O4@3 NPs. (b) In vivoT2-weighted coronal MR images of Fe3O4@3 NPs-injected saline-treated mice, Fe3O4@3 NPs-injected DOX-treated mice, Fe3O4@3-Scr NPs-injected saline-treated mice, and Fe3O4@3-Scr NPs-injected DOX-treated mice at 0 h (left) or 3 h postinjection (right). Injection dose: 9.8 mg Fe kg–1. Tumors in the mice were marked with false color to show the significant difference in MR signal intensity. Reproduced with permission from ref (85). Copyright 2016 American Chemical Society.

