Figure 5.
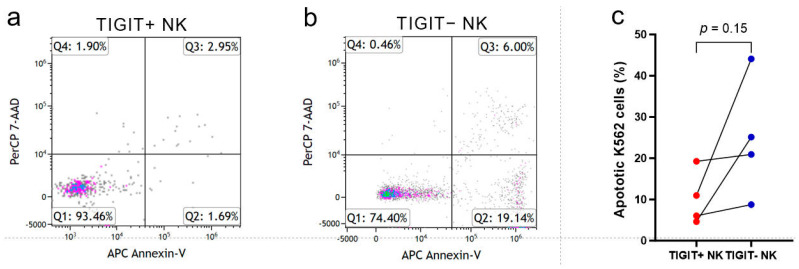
The impact of TIGIT expression on NK cell killing activity against K562 cells of four newly diagnosed CBFAML patients. The representative dot plots of the expression of apoptosis markers 7AAD and Annexin-V of K562 cells after co-culturing with TIGIT+ NK (a) and TIGIT− NK cells (b). Pairwise comparison of apoptotic K562 cell proportion between TIGIT+ NK and TIGIT− NK cells (c). The apoptotic K562 cell proportion is calculated by the addition of Q2 and Q3 (a,b). The dots in the subfigure (a,b) referred to the fluorescence intensity of each K562 cell. The red and blue dots in the subfigure (c) referred to the rates of apoptotic K562 cells co-cultured with TIGIT+ NK and TIGIT− NK cells, respectively.

