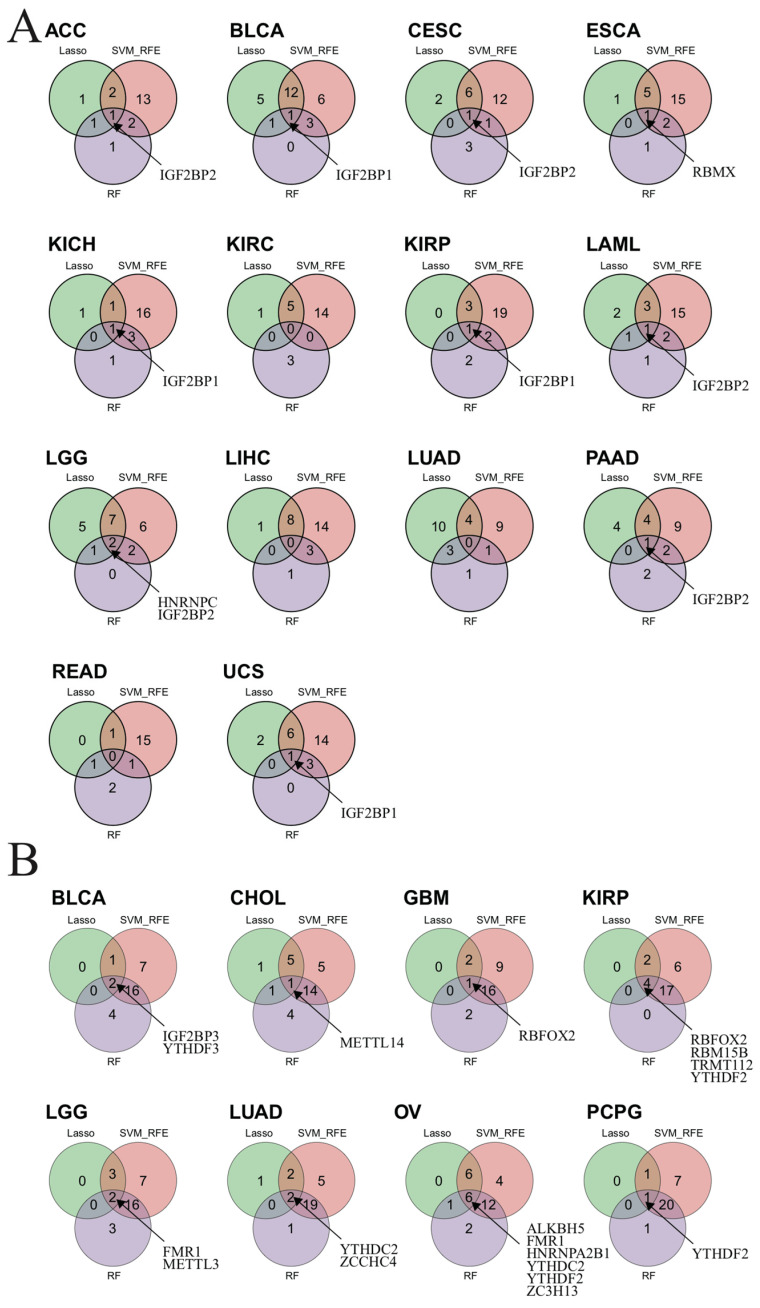
Figure 8.
Identifying m6A-related biomarkers using three machine-learning algorithms. (A) The Venn plot shows biomarkers obtained from the intersection of results from SVM-RFE, RF, and LASSO algorithms, based on the RNA expression levels in each cancer type. (B) The Venn plot shows biomarkers obtained from the intersection of results from SVM-RFE, RF, and LASSO algorithms based on the CNV data in each cancer type.

