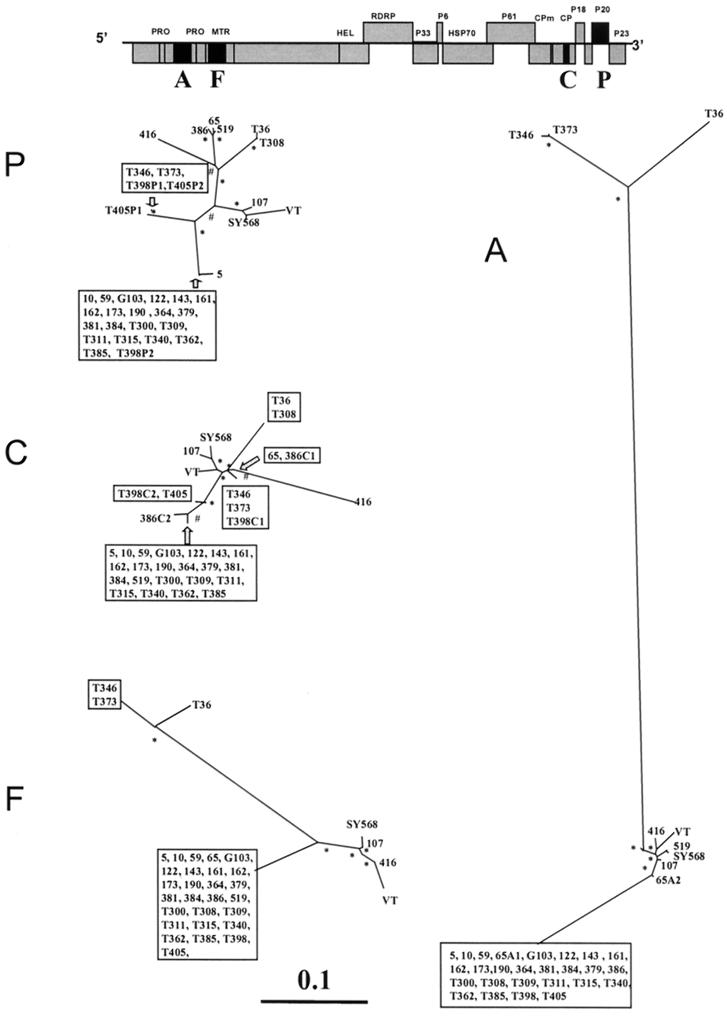
FIG. 1.
Unrooted maximum-likelihood phylogenetic trees of genomic regions A, F, C, and P (see also Table 2) of 34 CTV isolates (Table 1), constructed using the PHYLIP program DNAML. Bootstrap values of between 600 and 800 for 1,000 replicates are indicated by #, and values greater than 800 are indicated by ∗. Branch lengths are proportional to the genetic distances. Boxes include sequences with a nucleotide identity of greater than 99%. Above is a layout of the CTV genome, with the regions analyzed in black boxes. When an isolate contained more than one major sequence, these are indicated by a letter (corresponding to the genomic region) and a number (corresponding to the sequence variant), e.g., 65A1 and 65A2 occurred in genomic region A of isolate 65.

