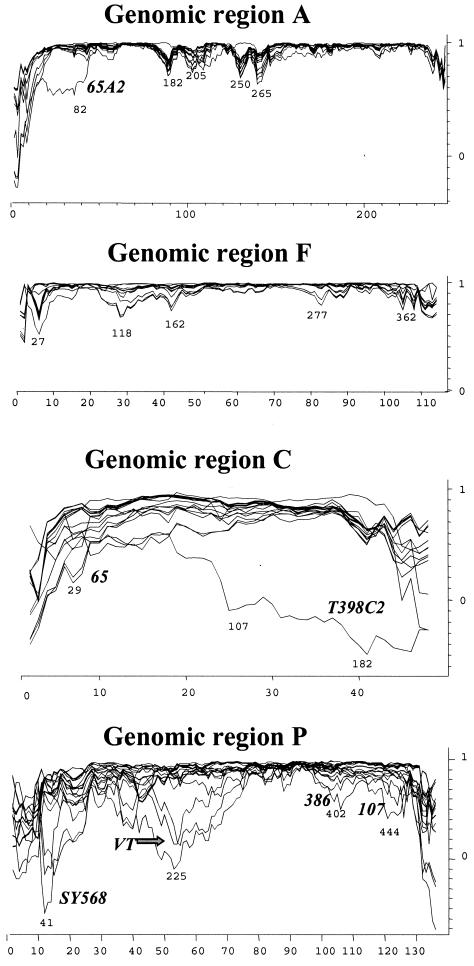
FIG. 2.
Phylogenetic correlation profiles (graphic representation of the coherence of sequence relationships) of 34 CTV isolates (Table 1) for genomic regions A, F, C, and P (Table 2). Only the variable sites (x axis) are represented in the graph. Phylogenetic correlation (y axis) was obtained at each variable site from pairwise distance analysis of all aligned sequences by using the program PHYLPRO, with a fixed window of 40 bp. Numbers under low phylogenetic correlation areas (possible recombination signals) indicate nucleotide positions. Some CTV sequences are indicated near their individual correlation profiles.

