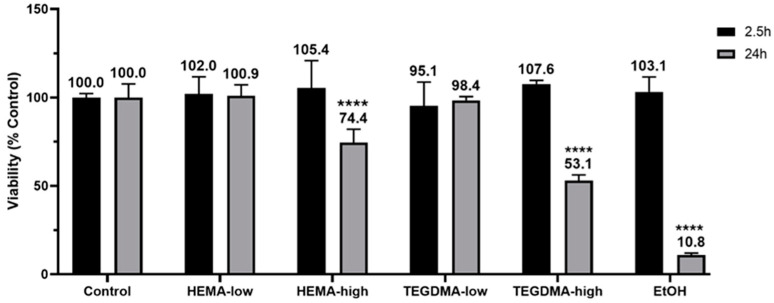
Figure 5.
Tissue viability (n = 3) after exposure to HEMA and TEGDMA for 2.5 h (black columns) and 24 h (gray columns). Mean values are annotated above each column, and asterisks indicate statistically significant differences between the tested materials compared to the relevant control (**** p ≤ 0.0001).

