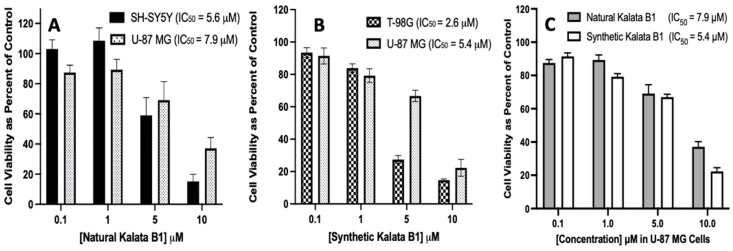
Figure 7.
Comparison of IC50 values for natural and synthetic Kalata B1, as determined in SH-SY5Y, U-87 MG, and T-98G human cell cultures. Panel (A) includes SH-SY5Y and U-87 MG cells, panel (B) includes T-98G and U-87 MG cells, and panel (C) is natural Kalata B1 and synthetic Kalata B1 with concentrations of 0.1, 1, 5, and 10 μM as compared to the control. Cultures were plated in 96-well pates at 6000 cells/well, then treated with cyclotides, as indicated, for 72 h, then assayed using MTT. Cell viability was calculated as a percentage of control (where the control cells were treated with DMSO only). Incubations were conducted in 96-well plates in triplicate wells (technical replicates) and as three independent incubations (biological replicates, n = 3). Data are expressed as mean ± standard error of the mean (SEM). IC50 values were calculated using the Best Fit method in GraphPad Prism version 8.0 (IC50 Best Fit). Results are graphed in GraphPad Prism version 8 for iOS.

