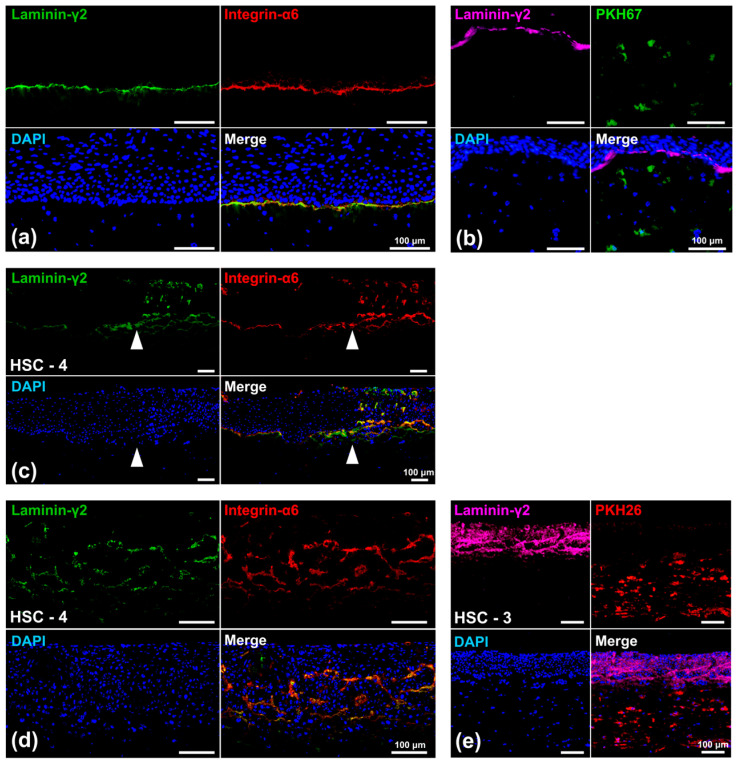
Figure 7.
Representative immunohistochemical findings of the 3D organotypic in vitro oral cancer model comprising HSC-3 or HSC-4 cells. Microscopic images of the “normal oral mucosa” portion (a,b), the border area between normal oral mucosa and cancer tissue (HSC-4 cells) (c), and the “oral cancer tissue” portion ((d): HSC-4 cells; (e): HSC-3 cells) are displayed. White arrowheads indicate the border between NOKs and oral cancer (HSC-4) cells (c). Those models were examined with immunofluorescent staining against laminin-γ2 (green), integrin-α6 (red), and DAPI (blue) (a,c,d). A linear co-expression of laminin-γ2 and integrin-α6 was observed at the basement membrane zone in the merged image of the “normal oral mucosa” portion (a,c). The co-expression of laminin-γ2 and integrin-α6 was observed within the OSCC (HSC-4 cells) layer in the merged image of the “oral cancer tissue” portion (c,d). Other models, in which PD-NOFs and PD-CAFs were prelabeled with PKH-67 (green) and PKH-26 (red), respectively, were examined by immunofluorescent staining against laminin-γ2 (purple) and DAPI (blue) (b,e). Scale bar = 100 μm.

