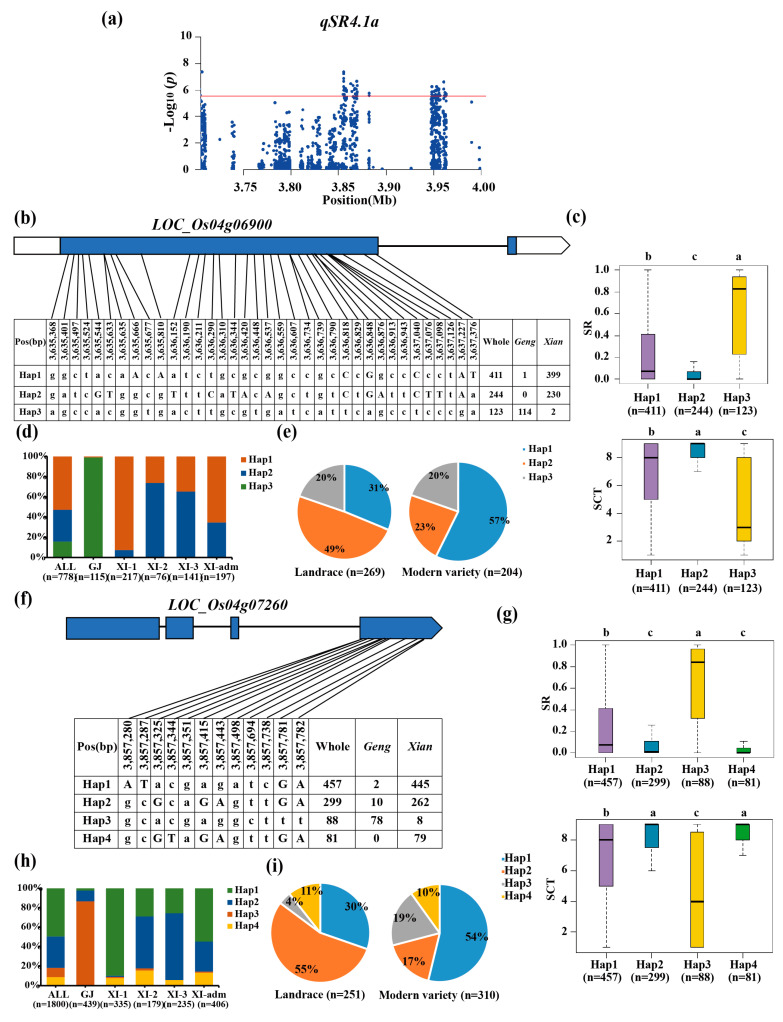
Figure 3.
Candidate gene analysis of qSR4.1a for cold tolerance. (a) Local Manhattan plot (top) of 150 kb upstream and downstream around the lead SNP rs4_3,633,378 (LOC_Os04g06900) and rs4_3,855,187 (LOC_Os04g07260). Codon-haplotypes of LOC_Os04g06900 (b) and LOC_Os04g07260 (f). The distribution of SR in the accessions for haplotypes (n > 40 accessions) of LOC_Os04g06900 (c) and LOC_Os04g07260 (g). Different letters above each boxplot indicate significant differences among haplotypes (p < 0.05, Duncan’s multiple range post-hoc test). Haplotype frequency distribution of LOC_Os04g06900 (d) and LOC_Os04g07260 (h) in different subpopulations. The type of each accession was from the metadata of the 3K-RGP [15]. Frequency of haplotypes of LOC_Os04g06900 I and LOC_Os04g07260 (i) in the landrace and modern variety populations. Letter n indicates the number of rice accessions belonging to the corresponding subpopulations in (c,d,g,h), or the variety type in (e,i), respectively. Horizontal lines indicate in the Manhattan plots indicate the genome-wide suggestive thresholds.

