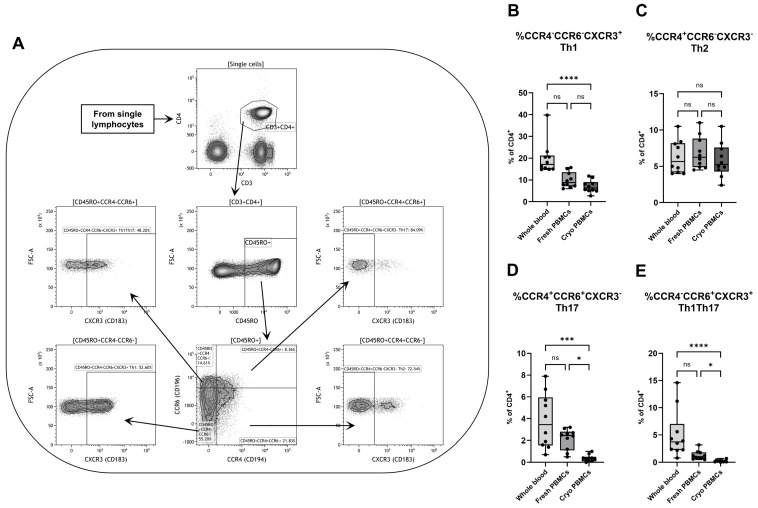
Figure 2.
Flow cytometry analysis of different CD4+ T helper subpopulations with (A) a representative gating strategy for a PBMC sample. The percentages of CD4+ T cells with (B) Th1 (CCR4−CCR6−CXCR3+), (C) Th2 (CCR4+CCR6−CXCR3−), (D) Th17 (CCR4+CCR6+CXCR3−) and (E) Th1Th17 (CCR4−CCR6+CXCR3+) phenotypes were analyzed by flow cytometry. PBMCs = peripheral blood mononuclear cells. Cryo = cryopreserved. ns = non-significant. Paired non-parametric Friedman test, followed by Dunn’s multiple comparisons test, n = 10. * Indicates p < 0.05, *** p < 0.001 and **** p < 0.0001 (adjusted p-values).

