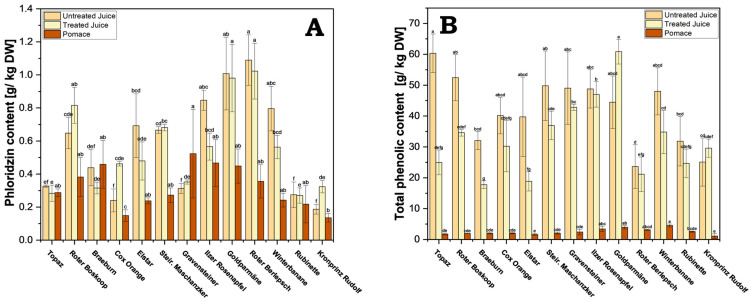
Figure 5.
(A) Phloridzin content of the processed juice samples (treated and untreated) and pomace. Results are shown as g phloridzin per kg dry weight (DW); (B) total phenolic content for processed juice (treated and untreated) and pomace. Results are shown as g gallic acid equivalents per kg dry weight (DW). The HPLC measurements were performed in triplicates. Different letters (a, b, c, etc.) between cultivars indicate statistically significant differences (p < 0.05).

