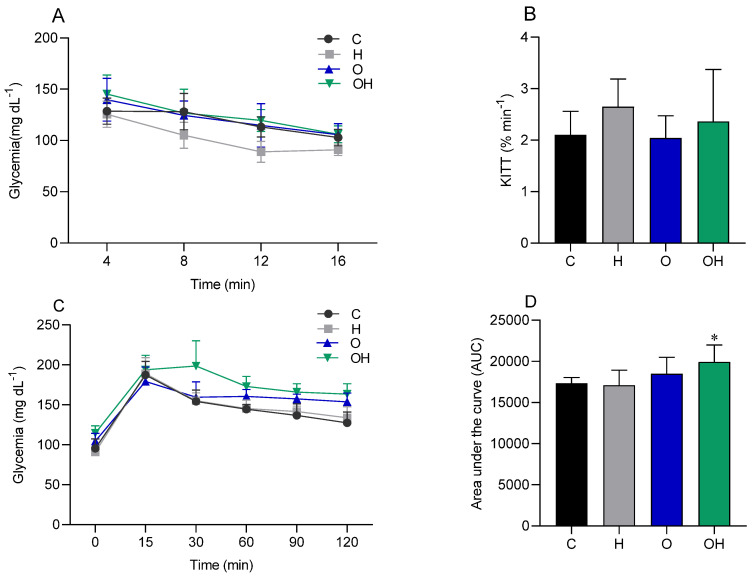
Figure 2.
Glycemic curve (A) and glucose decay constant (KITT) (B), generated by the intraperitoneal insulin tolerance test (IPITT), in the control (C), liposomes (H), obese (O) and obese + liposomes (OH) groups. Glycemic curve (C) and area under the curve (D), generated by the oral glucose tolerance test (OGTT) of the control (C), liposomes (H), obese (O) and obese + liposomes (OH) groups. Data are expressed as mean ± standard deviation. Analysis was performed by ANOVA (two-way) and Tukey’s test. * p < 0.05 compared with C; (n = 8).

