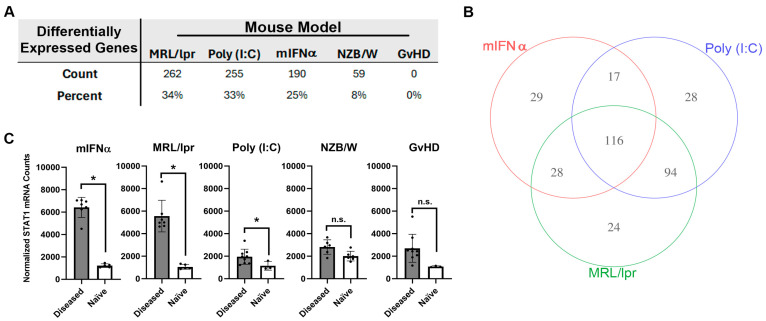
Figure 1.
Analysis of autoimmunity- and inflammation-associated mRNA expression in kidney tissue harvested from animal models of SLE/LN. (A) DEGs in each animal model reported as both total count and percentage of all genes measured. (B) Venn diagram of significant genes identified in the mIFNα, poly (I:C) and MRL/lpr animal models of SLE/LN. Significance was determined using one-way ANOVA model at significance cutoff of adjusted p-value of 0.1 and at least 1.5-fold change between diseased and naïve mice. (C) Differential expression of Stat1 mRNA between diseased and naïve mice for each animal model. Asterisks indicate significant differences. Bars indicate mean +/− standard deviation.

