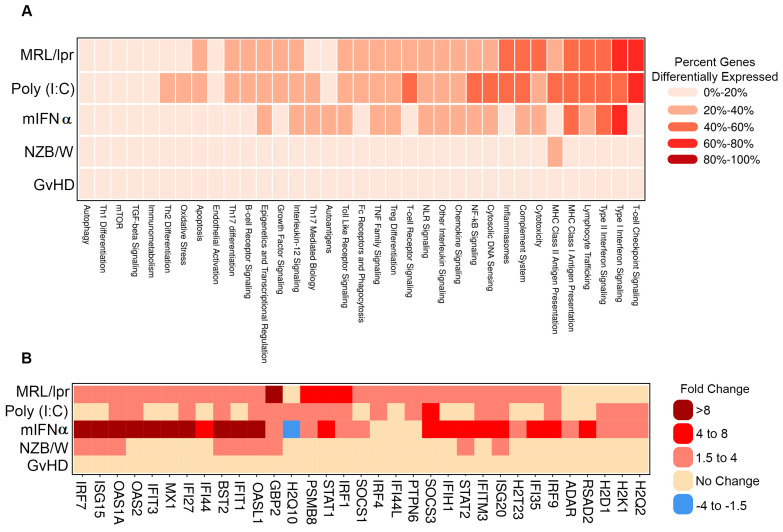
Figure 2.
Pathway analysis of DEGs in animal models of SLE/LN. (A) Heatmap of modulated pathways (columns) for each animal model (rows). Colors binned by number of DEGs as a percentage of total genes for each pathway. (B) Heatmap of selected individual gene expression changes (columns) for genes in the Type I interferon signaling pathway, for each animal model (rows). Colors binned by fold changes (diseased vs. naïve mice) for each gene.

