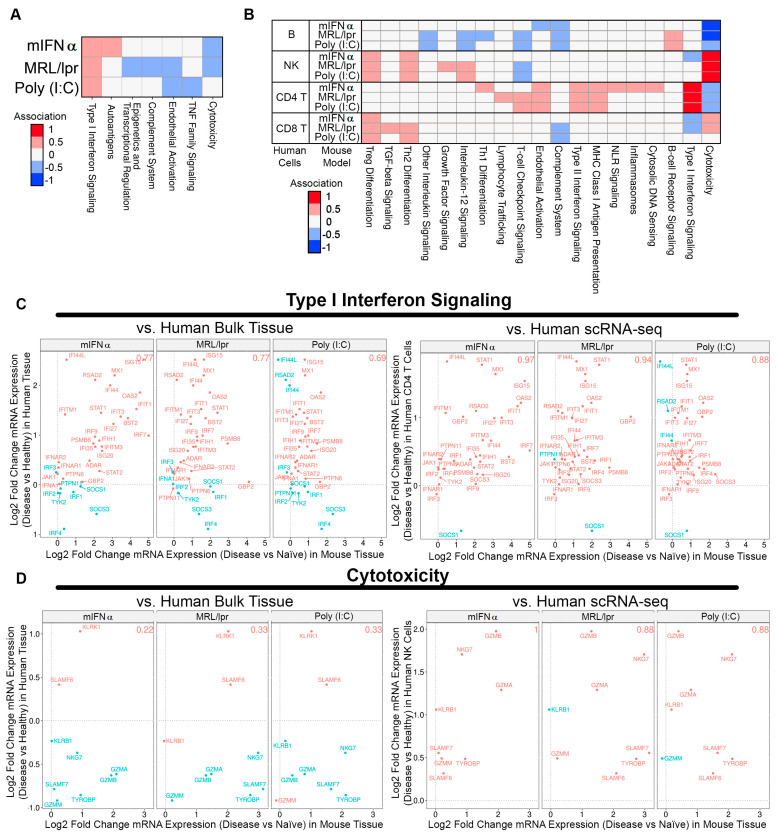
Figure 3.
Comparing gene signatures of SLE/LN human bulk kidney tissue or scRNA-seq with SLE/LN animal model gene expression profiles. (A) Heatmap of associations between human bulk tissue and SLE/LN animal models (rows) for selected pathways (columns). (B) Heatmap of associations between human scRNA-seq cell types and SLE/LN animal models (rows) for selected pathways (columns). (C) Association plots for human bulk tissue (left, y-axis) or human CD4 T cells from scRNA-seq (right, y-axis) with animal model tissue (x-axis) for Type I interferon signaling pathway genes. Proportional association scores indicated for each comparison (top right). (D) Association plots for human bulk tissue (left, y-axis) or human NK cells from scRNA-seq (right, y-axis) with animal model tissue (x-axis) for cytotoxicity pathway genes. Proportional association scores indicated for each comparison (top right).

