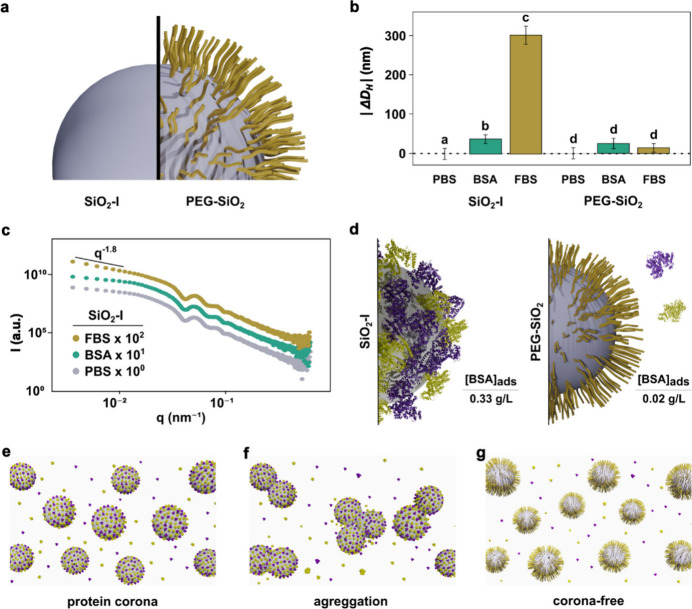
Figure 2.
(a) Schematic representation of nanoparticles used in the second part of this work, bare SiO2-I and PEG-SiO2. (b) Absolute value of the variation in hydrodynamic diameter (|ΔDH|) of SiO2-I and PEG-SiO2 in PBS, BSA, and FBS media. Results are displayed as mean ± standard deviation. One-way analysis of variance (ANOVA) with Tukey’s test were used for data statistical analysis. Differences were considered significant when P < 0.05. Bars labeled with the same letter indicate no significant difference, while bars labeled with different letters represent statistically significant differences. (c) SAXS curves of bare SiO2-I in PBS, BSA, and FBS media. (d) Comparison between the concentration of BSA in the precipitated ([BSA]ads) obtained by BCA assay for SiO2-I and PEG-SiO2. Schematic representation of (e) protein corona formation on the surface of bare SiO2-I. (f) Aggregation of bare SiO2-I and the (g) corona-free effect of PEG-SiO2.

