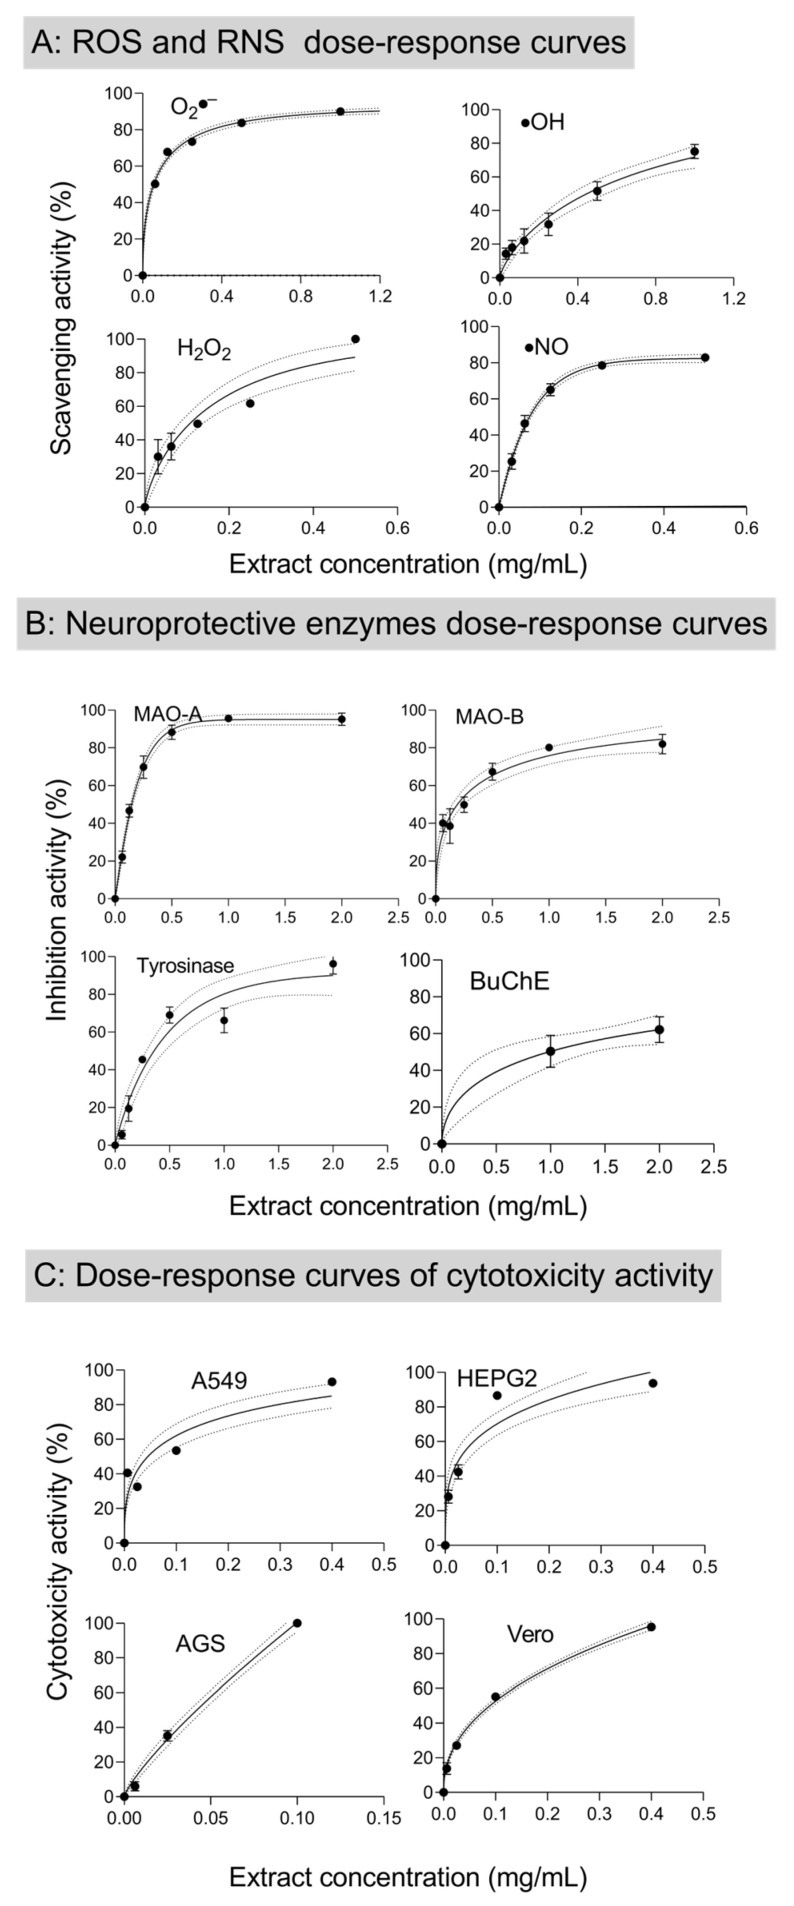
Figure 2.
Weibull model fitting curve of dose–response relationship of BB scavenging activity to: (A) ROS and NOS (O2•−, H2O2,∙•NO and •OH); (B) inhibition activity of MAO–A, MAO–B, BuChE, and tyrosinase enzymes; and (C) anti-proliferation of HEPG2, AGS, A459, and Vero cells. Dotted bands represent 95% confidence levels. Error bars represent the standard deviation.

