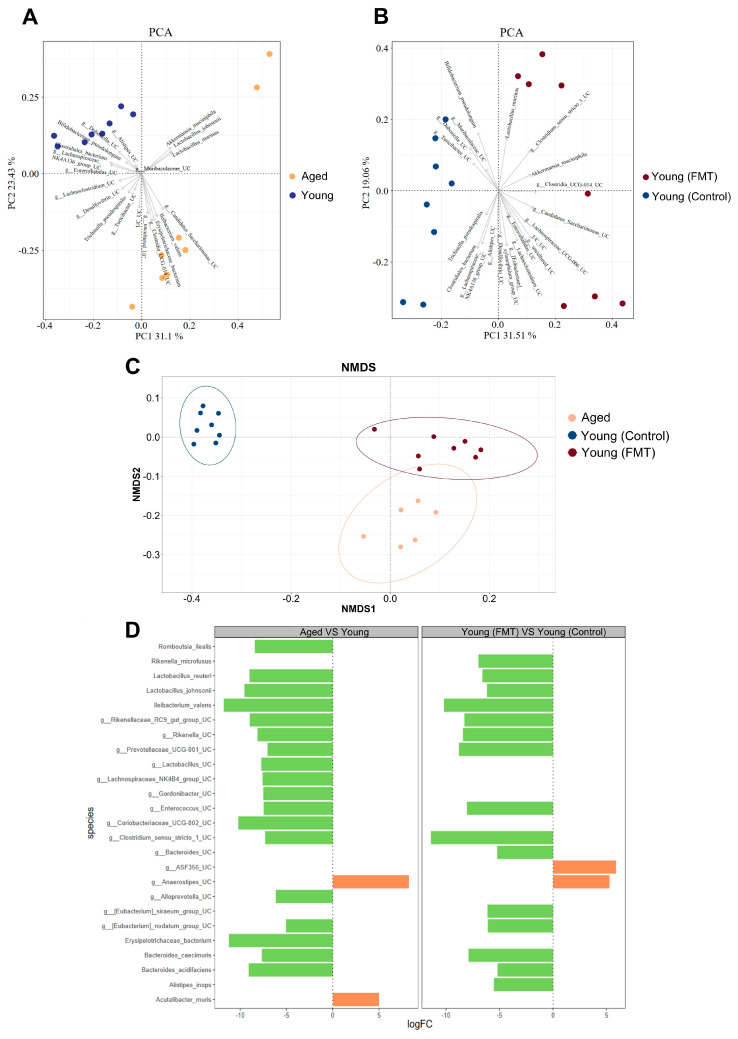
Figure 5.
Effects of aged-to-young FMT on gut microbial profiles in young host mice. (A) Principal component analysis (PCA) plot revealing distinct clusters for fecal microbiome samples obtained from young (depicted in blue) and aged (in brown) mice before antibiotic treatment and FMT, highlighting the species contributing to this clustering. N = 8 per group. (B) PCA plot showing the clustering of fecal microbiome samples from young-transplanted (Young (Control); depicted in blue) and aged-transplanted mice (Young (FMT); in red). N = 8 per group. (C) Non-Metric Multi-Dimensional Scaling (NMDS) plot displaying the clustering of microbiome across various mouse groups. N = 6–8 per group. (D) Differential abundance analysis on the mean difference in centered log ratio for enriched species in young, aged, Young (Control) and Young (FMT) mice. N = 8 per group.

