Figure 6.
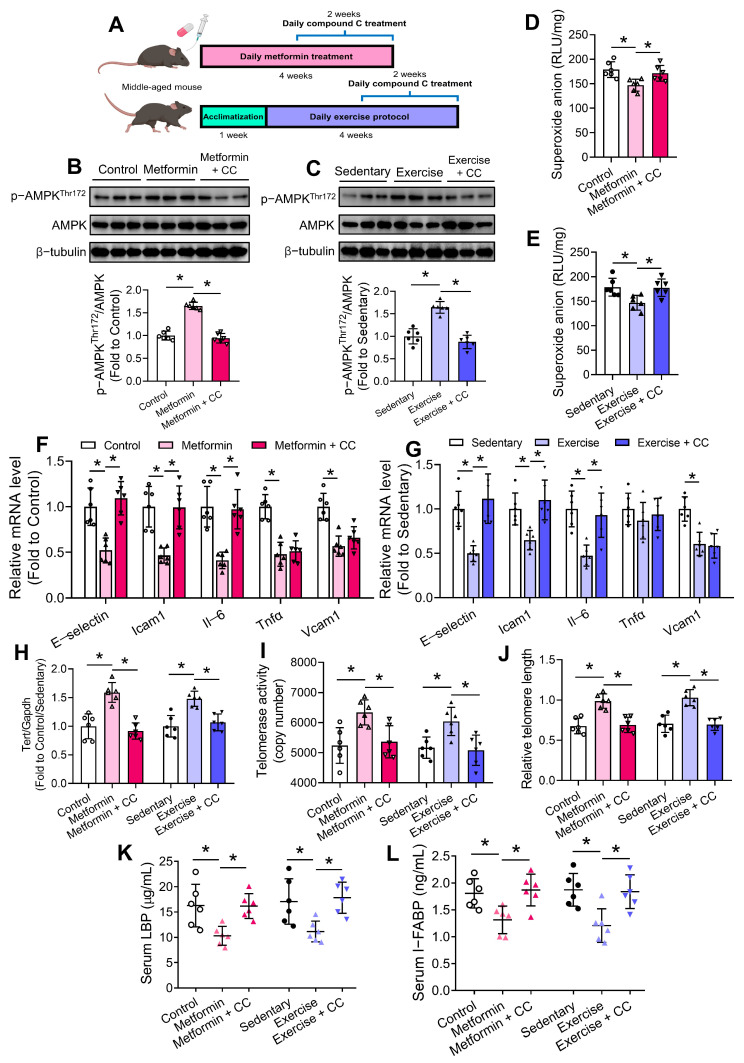
Effects of chronic metformin treatment and moderate exercise training on intestinal homeostasis. (A) Schematic diagram on chronic metformin treatment and moderate exercise training with the presence and absence of compound C (CC) treatment in middle-aged C57BL/6 mice. Representative Western blots and quantification of Western blotting on expression of AMPK and p-AMPK at Thr172 in intestines of (B) metformin-treated mice, and (C) exercise-trained mice. Lucigenin-enhanced chemiluminescence on intestinal ROS levels of (D) metformin-treated mice, and (E) exercise-trained mice. RT-PCR on mRNA levels of pro-inflammatory genes in intestines of (F) metformin-treated mice, and (G) exercise-trained mice. (H) Tert mRNA level in intestines of different mouse groups. (I) Telomerase activities in intestines of different mouse groups. (J) Relative telomere length in intestines of different mouse groups. ELISA on serum levels of (K) LBP and (L) I-FABP of different mouse groups. N = 6 per group. Data are mean ± SD. * p < 0.05; Brown-Forsythe and Welch ANOVA and Dunnett T3 test.

