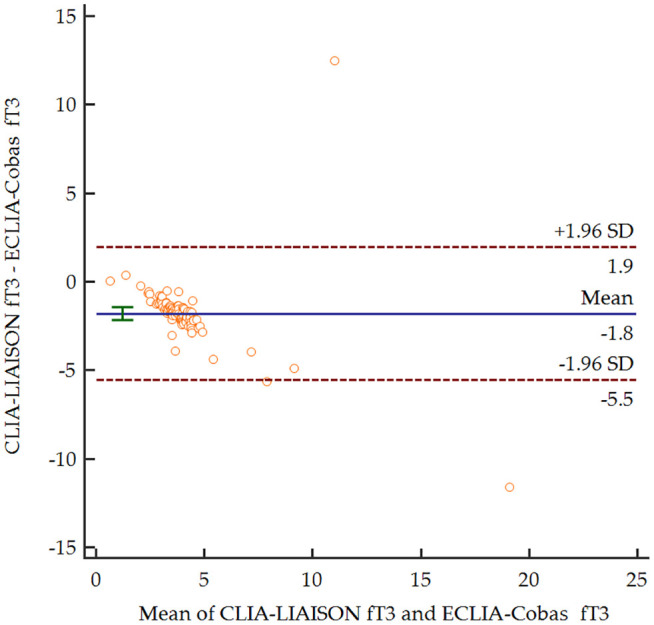
Figure 3.

Bland–Altman plot comparing serum levels of fT3 depending on the measurement method.
CLIA-LIAISON, Chemiluminescence immunoassay LIAISON XL®, DiaSorin; ECLIA-Cobas, Electrochemiluminescence immunoassays Elecsys® Cobas e801, Roche; fT3, free triiodothyronine; SD standard deviation.
