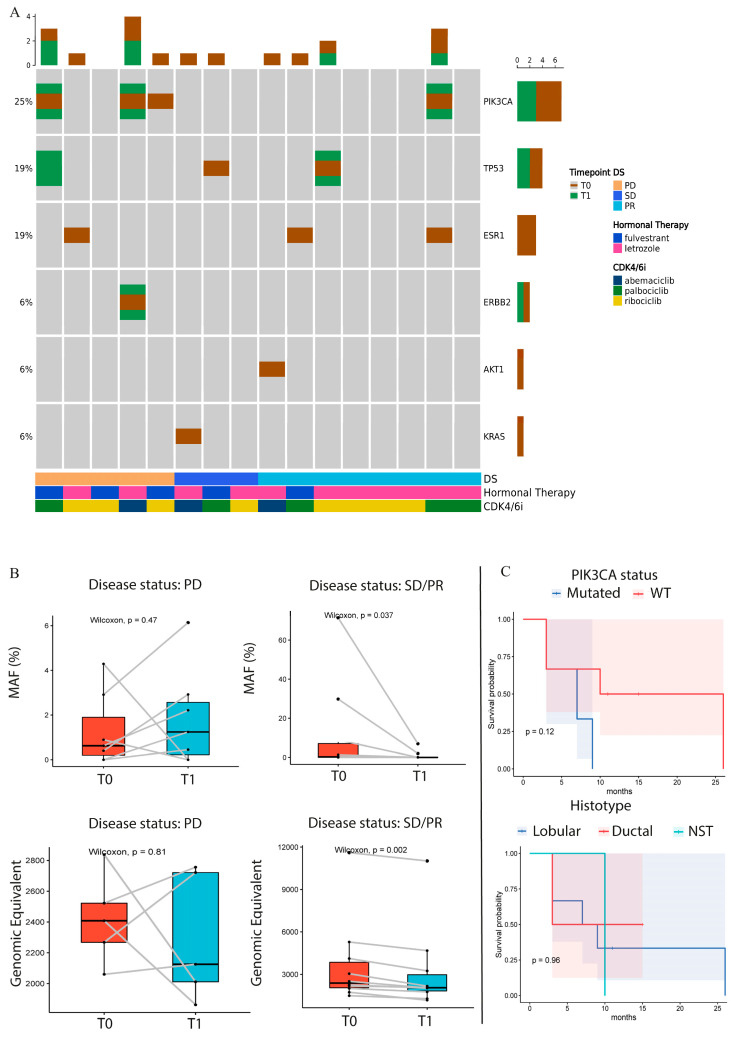
Figure 1.
(A) Oncoprint of identified variants (T0: baseline, T1: after 3 months, DS: disease status at T1). Columns represent individual plasma samples and are sorted by disease status (DS) and time points. Each gene affected by alterations is reported and sorted by frequency, which indicates the proportion of patients in whom the gene is mutated on the total number of patients (indicated on the left). The different colors represent the different time points (brown for T0, green for T1). The bar plots at the top and right of the Oncoprint indicate the count of events found, respectively, in each sample and in each gene. In the lower part of the Oncoprint, the disease status (DS), hormonal therapy, and CDK4/6i are indicated for each sample. PD: disease progression, SD: stable disease, PR: partial response. (B) The box plot shows the Wilcoxon test applied to the MAF% trend of alterations between T0 and T1 in patients who presented PD and patients with SD or PR. The box plot in the lower part of the figure shows the Wilcoxon test applied to the genomic equivalent of T0 and T1 samples in patients with PR or SD/PR. (C) Patient response in terms of PD or SD/PR. The cohort was divided into PI3KCA-mutated or WT in the upper KM plot and into lobular, ductal, and NST in the lower KM plot. T0: baseline; T1: collection time after 3 months of CDK4/6i treatment; PD: disease progression; SD: stable disease; PR: partial response; DS: disease status at T1; MAF: molecules allele frequency; WT: wild-type; NST: no special type.

