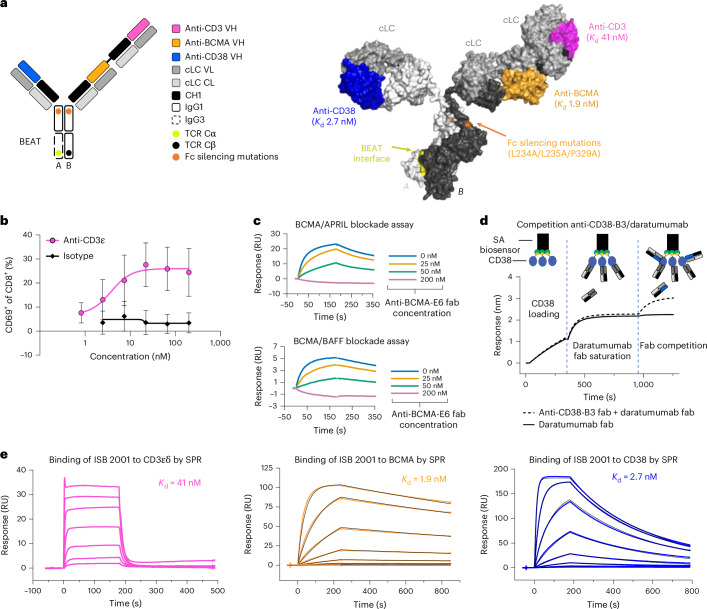
Fig. 1. Generation of ISB 2001, a CD3 × BCMA× CD38 trispecific antibody based on the BEAT platform.
a, Cartoon and structural model of ISB 2001 BEAT. On the cartoon, immunoglobulin domains are shown as rectangles. VH domains of the anti-CD38, anti-BCMA and anti-CD3ε binders are depicted in blue, orange and magenta, respectively. All binders make use of a cLC depicted in gray. Fc-silencing mutations are depicted by the orange dots. The BEAT interface shown in the CH3 domains is depicted by the green and black dots. Chain A encompasses an engineered human IgG1 CH2 domain with an engineered human IgG3 CH3 domain. Chain B has engineered human IgG1 CH2 and CH3 domains. CHx, constant domain x; TCR Cα or TCR Cβ, BEAT interface proprietary mutations based on the T cell receptor constant domain α or β, respectively. ISB 2001 BEAT was generated by homology modeling. b, Human T cell activation of anti-CD3ε produced as human IgG1 LALA and control isotype by incubating with a dose–response of the cLC Fab bound to the plate. Graph shows mean ± s.d. (n = 6 independent T cell donors from two independent experiments). c, SPR sensorgrams from a single replicate show blockade of BCMA/APRIL interaction (top sensorgram) and blockade of BCMA/BAFF interaction (bottom sensorgram) upon binding of anti-BCMA-E6 Fab to recombinant human BCMA protein. Curves are colored by anti-BCMA-E6 Fab concentration in BCMA/anti-BCMA premix solution. Data provided are from a single experiment (no repeats). d, Competition binding assay by Octet BLI. Curves represent injection of anti-CD38-B3 Fab/daratumumab Fab premix (dashed line) or daratumumab at twofold concentration of saturating solution (solid line) over CD38 immobilized surface saturated with daratumumab Fab from a single replicate in one experiment (no repeats). e, Binding sensorgrams of respective representative measurements from three independent replicates show the binding of ISB 2001 to human CD3εδ, human BCMA and human CD38 by SPR. Colored curves represent single concentration injections with serial dilutions of 1:3. Black curves represent 1:1 kinetic fits (BCMA and CD38). For binding to CD3εδ, the Kd was inferred from a steady-state affinity model.

