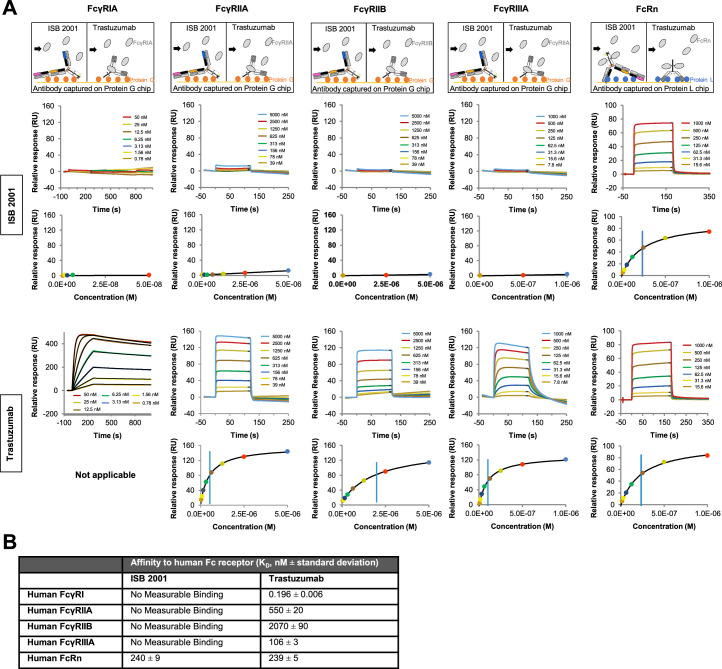
Extended Data Fig. 2. ISB 2001 Binding to Fc receptors by Surface Plasmon Resonance.
(a) Binding to the FcγR is silenced in ISB 2001. The binding of ISB 2001 to Fcγ receptors Ia, IIa, IIb, IIIa and FcRn was measured by SPR and compared to trastuzumab, a classical Fc-competent IgG1. Cartoons on top show schematic of the respective assay settings. For each receptor and molecule tested, the binding sensorgram and plot of equilibrium response versus concentration, when applicable, of a representative measurement are shown. On the binding sensorgrams, colored lines represent experimental data and black lines represent the fitted data. On the plot of equilibrium response versus concentration, colored dots represent experimental data, black curve represent fitted data and vertical blue bars represent inferred equilibrium dissociation constants (KD). For FcγRIA, IIA, IIB and IIIA no or too weak binding of ISB 2001 to Fc receptors was observed to infer a KD value. (b) Summary table of equilibrium dissociation constants (KD). Data are reported as the average of 3 independent measurements ± SD.

