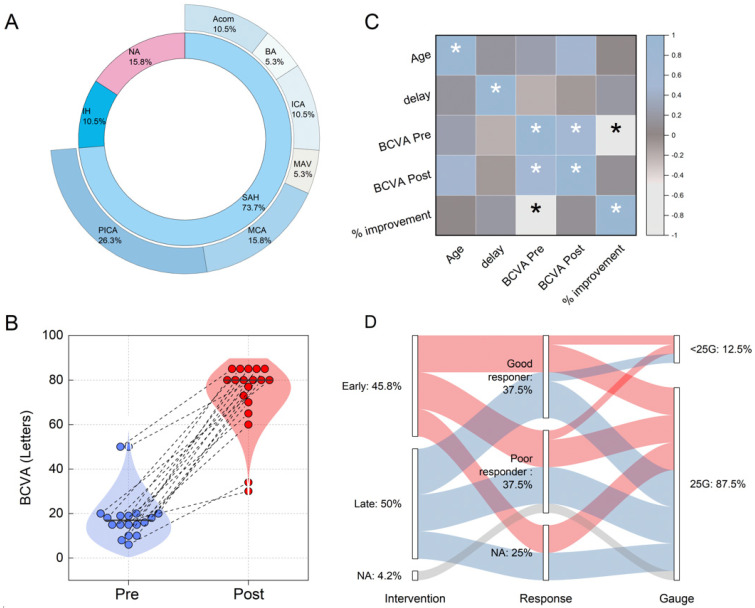
Figure 4.
(A) Sunburst plot illustrating the primary causes of intraocular hemorrhage within the inner circle and detailing the arterial locations or regions involved in subarachnoid hemorrhage (SAH) in the outer circle. (B) Visualization of changes in best-corrected visual acuity (BCVA) from pre- vitrectomy (blue dots) to post-vitrectomy (red dots) for each patient, with dashed lines connecting pre- and post-surgery values to highlight individual changes. (C) Correlation matrix employing Spearman’s coefficients to analyze the relationships among patient age, time delay to surgery, and BCVA changes before and after surgery. Asterisks (*) denote statistically significant correlations (p < 0.05). (D) Alluvial plot showing the timing of surgical intervention (early vs. late) linked to patient outcomes, categorized by treatment response into ‘good responders’ (those whose BCVA improvement was greater than or equal to the median increase of 325%) and ‘poor responders’ (those below this threshold). The plot also distinguishes the surgical gauge used, noting whether it was smaller or equal to 25 G, to explore the impact of instrument size on surgical outcomes.

