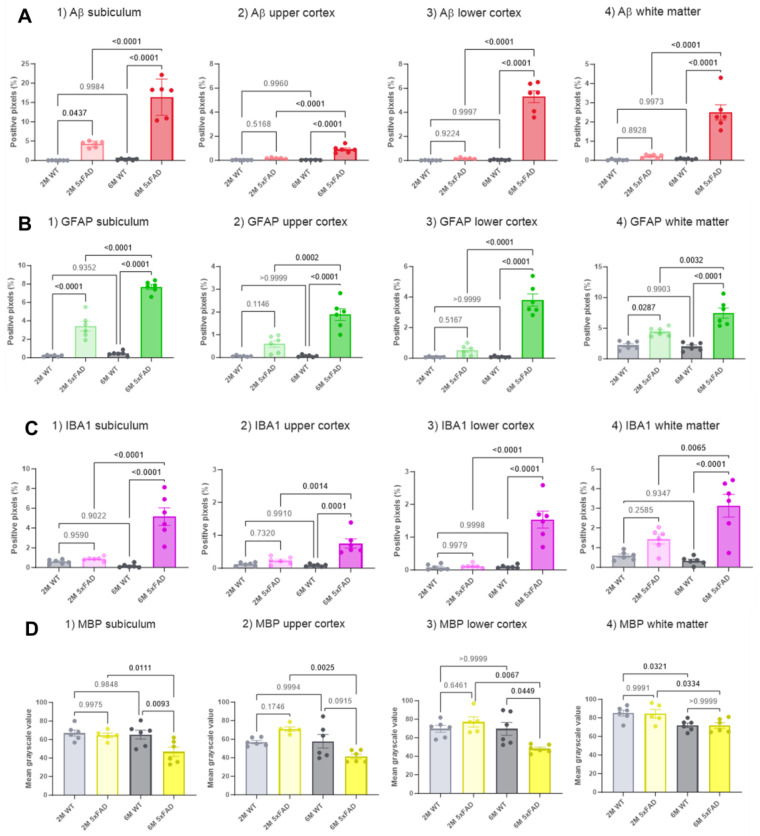
Figure 2.
Quantification of pathological markers in the brains of 5xFAD and WT mice at two ages. Fluorescence microscopy images (represented in Figure 1) were quantified, and the corresponding signal derived from the markers (A) Aβ, (B) GFAP, (C) IBA1 and (D) MBP is presented. Four different brain regions are shown: (1) subiculum, (2) upper cortex, (3) lower cortex, and (4) white matter. Each bar graph shows populations of the level of markers in 2M 5xFAD, 2M WT, 6M 5xFAD, and 6M WT mice. The bar graphs are presented as mean percentages of either positive pixels (A–C), or mean gray-scale value (D) ± SD. The number of brain slices is 6 (from 3 independent mice per genotype per age). The statistical comparisons (determined with ANOVA and Tukey’s test) are presented with p values above the bars, with the significant values in bold.

