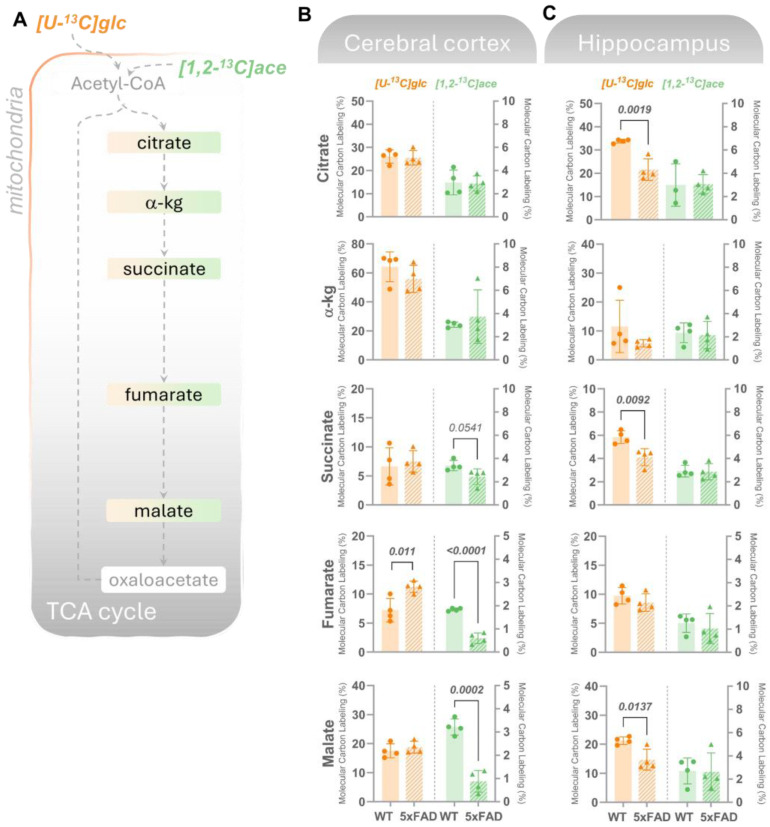
Figure 3.
Cortical acetate metabolism and hippocampal glucose metabolism is selectively affected in 6M 5xFAD brains. (A) Mitochondrial oxidative metabolism of [U-13C]glucose (glc, left axes orange bars) or [1,2-13C]acetate (ace, right axes, green bars) gives rise to 13C-enrichment (detected by GC–MS) in TCA cycle intermediates in acutely isolated slices from (B) cerebral cortex or (C) hippocampus incubated with the labeled substrates for 60 min. Molecular carbon labeling (MCL), the weighted average of the carbon labeling in given metabolic intermediates, is presented. [U-13C]glucose reflects overall energy metabolism where neurons are the main energy consumers, while [1,2-13C]acetate is predominantly metabolized in astrocytes. In the cerebral cortex, overall maintained 13C-incorporation in TCA cycle metabolites from [U-13C]glucose was observed, while lower MCL in intermediates from [1,2-13C]acetate was found in 5xFAD mice compared to wild-type (WT) controls. The opposite was observed for the hippocampal slices, where a lower MCL in intermediates resulting from [U-13C]glucose metabolism but maintained [1,2-13C]acetate was detected in the 5xFAD mice vs. WT. Values represent mean (±) SD (n = 4 animals). WT animals are represented as circles, while 5xFAD animals are represented as triangles. The statistical significance (determined with Student’s unpaired t-test) is presented with p values above the bars, with significant values in bold.

