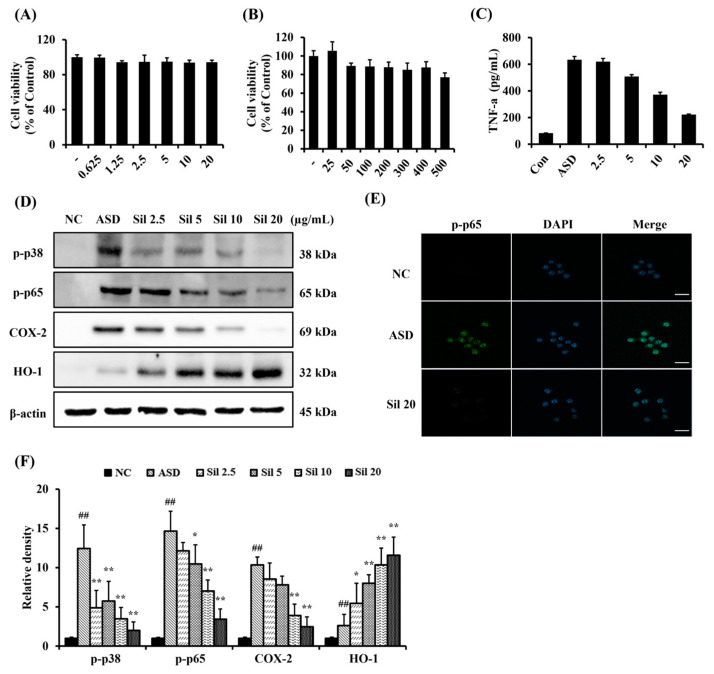
Figure 2.
Effects of silibinin on inflammatory responses in ASD-stimulated RAW264.7 cells. (A) silibinin cell viability, (B) ASD cell viability, (C) level of TNF-α, (D) Western blot analysis Re-sults, (E) representative figure showing immunofluorescence for p-p65, (scale bar: 50 μm), and (F) densitometric value of protein expression. The data are shown as the mean ± standard deviation. ##, vs. NC, *,**, vs. ASD-stimulated RAW264.7 cell, p < 0.05 and <0.01, respectively.

