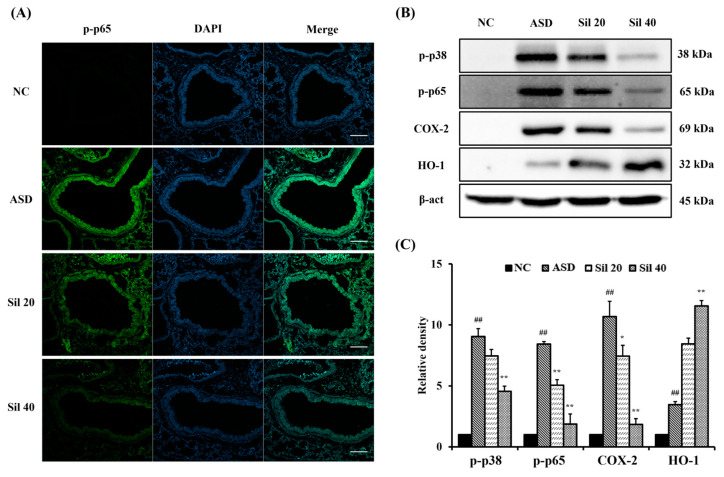
Figure 5.
Effects of silibinin on the signaling pathway related to inflammation and oxidative stress in ASD-exposed mice. (A) Representative figure of p-p65 expression in the lung tissue (scale bar: 100 μm), (B) Western blot analysis results, and (C) densitometric value of protein expression. NC, PBS intranasal instillation + PBS; ASD, ASD intranasal instillation + PBS; Sil 20 and 40, ASD intranasal instillation + silibinin (20 and 40 mg/kg, respectively). The data are presented as the mean ± standard deviation (n = 7). ##, vs. NC, p < 0.01; *, **, vs. ASD, p < 0.05 and <0.01, respectively.

