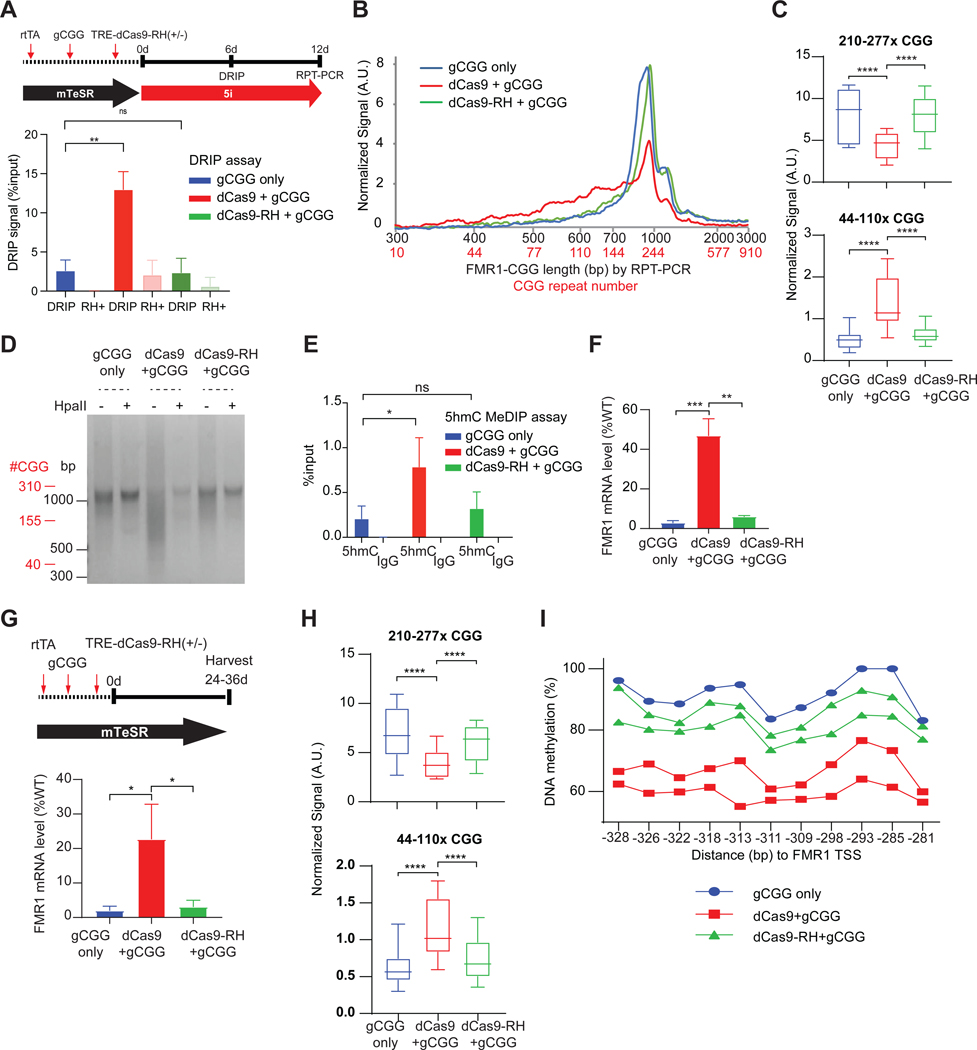
Figure 5. Site-specific R-loops underlie repeat contraction.
See also Figure S4.
(A) DRIP assay at the FMR1 TSS in 848–1c iPSC treated as shown in schematic (top panel), with gCGG alone, dCas9+gCGG, or dCas9-RH+gCGG for 6 days. t-test: **, P<0.01. ns, not significant.
(B) Bioanalyzer analysis of RPT-PCR product length and estimated CGG repeat copy number for the samples depicted in (A).
(C) Box plot quantitation of high (210–277x CGGs) versus low (44–110x CGGs) copy numbers after indicated treatment for 12 days. t-test: ****, P<0.0001
(D) Gel electrophoresis of CGG RPT-PCR products +/− HpaII digestion in 848–1c iPSC, treated for 12 days using the scheme shown in (A).
(E) 5hmC MeDIP assay at the FMR1 5’UTR in 848–1c iPSC treated, with gCGG alone, dCas9+gCGG, or dCas9-RH+gCGG for 6 days. t-test: *, P<0.05. ns, not significant.
(F) RT-qPCR of FMR1 mRNA levels for corresponding samples shown in (A-E). t-test: **, P<0.01; ***, P<0.001.
(G) Top: Timeline to test sufficiency of dCas9-targeted R-loops in 848–1c iPSC without 5i treatment. Bottom: RT-qPCR of FMR1 mRNA levels following 24-day exposure to gCGG alone, dCas9+gCGG, or dCas9-RH+gCGG. t-test: *, P<0.05.
(H) Box plot quantitation of high (210–277x CGGs) versus low (44–110x CGGs) copy numbers after indicated treatment in (G). t-test: ****, P<0.0001.
(I) Pyrosequencing to examine DNA methylation at FMR1 promoter for samples in (G,H).

