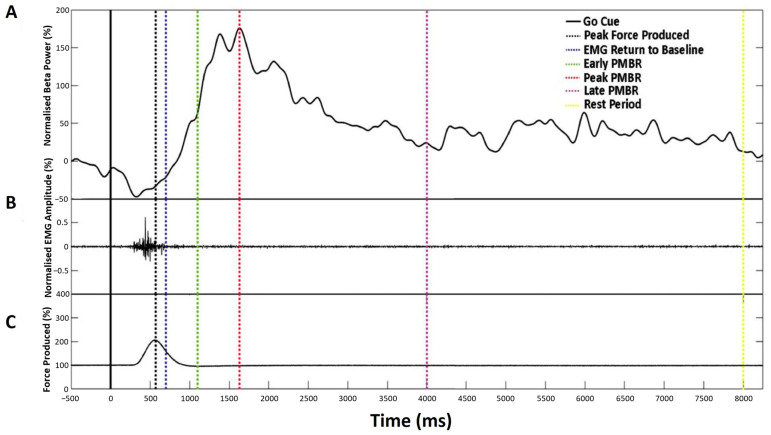
Figure 3.
Characterisation of the beta-change time-points for TMS stimulation showing a representative single trial for an individual participant. (A) Normalised beta power at individual peak frequency, (B) Normalised EMG amplitude, and (C) Mean force production. Dashed vertical lines indicate the time-point selected for stimulation, as summarised in Table 1.

