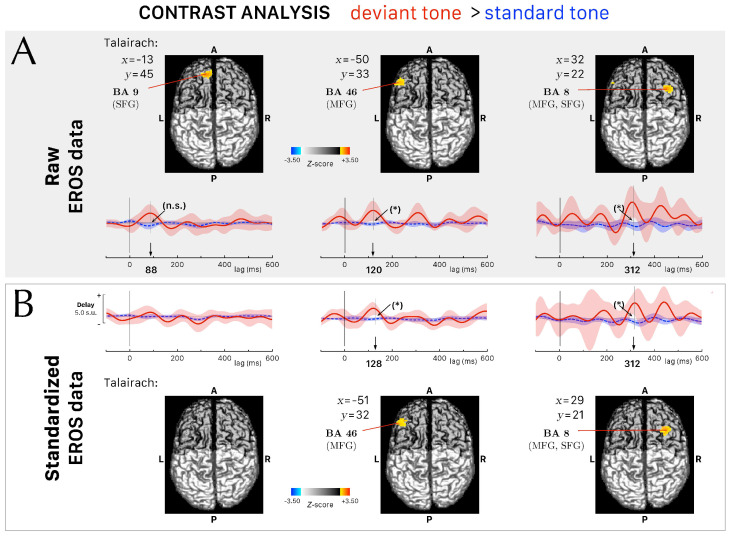
Figure 3.
Differential activations in the event–related optical signals (EROS) following a contrast analysis (deviant tone > standard tone, Z-score , n > 10. (A) Raw EROS data analysis. The upper panels show the axial projection of the Z-score surface maps (computed across subjects) on a template MRI for the contrast analysis at 88, 120, and after stimulus onset. The Talairach coordinates x and y of the voxels with the greatest differential activation are indicated with the corresponding Brodmann area (BA) and nearest cortical gyri. The corresponding Talairach z coordinate is on the cortical surface. The lower panels show the corresponding EROS grand–average curves (mean SEM), from before stimulus onset to after stimulus onset. of the peak voxel and its direct neighboring voxels during the deviant (red) and the standard (dashed blue) tones conditions. An arrow indicates the timing of the greatest differential activation with a sign (n.s.) not significant and (*) , for the significance level of the differential activation at the peak latency with multiple comparison correction within the associated ROI. (B) Standardized EROS data analysis. The upper panels show the axial projection of the new Z-score surface maps (computed across subjects) on a template MRI recomputed following the standardization procedure described in the Methods Section 2.4, for the contrast analysis at 88, 128, and after stimulus onset. At , no voxel of the differential activation reached the threshold level Z-score , n > 10. At 128 and after stimulus onset, the Z-score of the differential activations was above the threshold level and remained significant () even after multiple comparison correction within the associated ROI.

