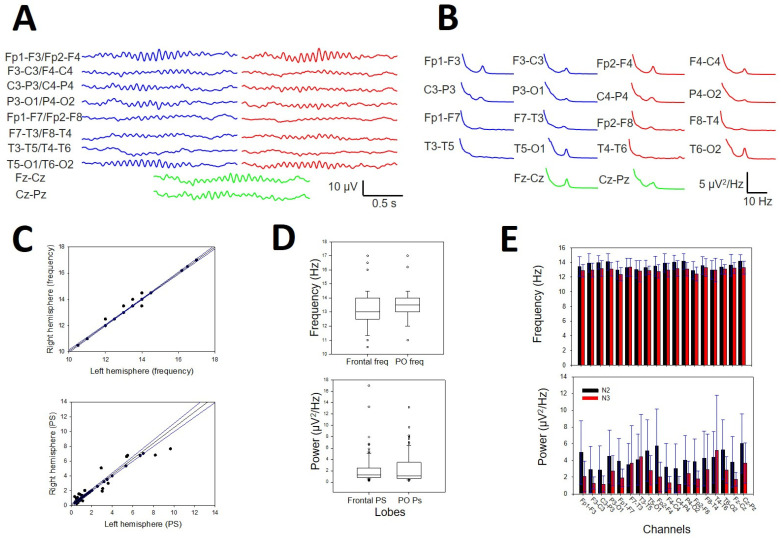
Figure 9.
Numerical properties of SSs. (A) An example of SSs from a patient. (B) aPS for all the channels in the same patient. A prominent peak of 13 Hz (σ band) is clearly observed in 14 graphs; blue lines = left hemisphere, red lines = right hemisphere, and green lines = midline. (C) Upper row. Linear regression ± 95% confidence band for the average frequency of the symmetric channels in both hemispheres (r = 0.9961; p < 10−4, function ). Lower row. Linear regression ± 95% confidence band for the average power of the symmetric channels of both hemispheres (r = 0.9924; p < 10−4, function ) (D) Upper row. Box plot for the pF at frontal and parieto-occipital lobes. Lower row. Box plot for mP frontal and parieto-occipital lobes. (E) The bar graph for the frequency (upper row) and the power for all the channels at the N2 and N3 sleep stages. Black = N2 stage; red = N3 stage. The error bars are the CIs.

