
Figure 6.
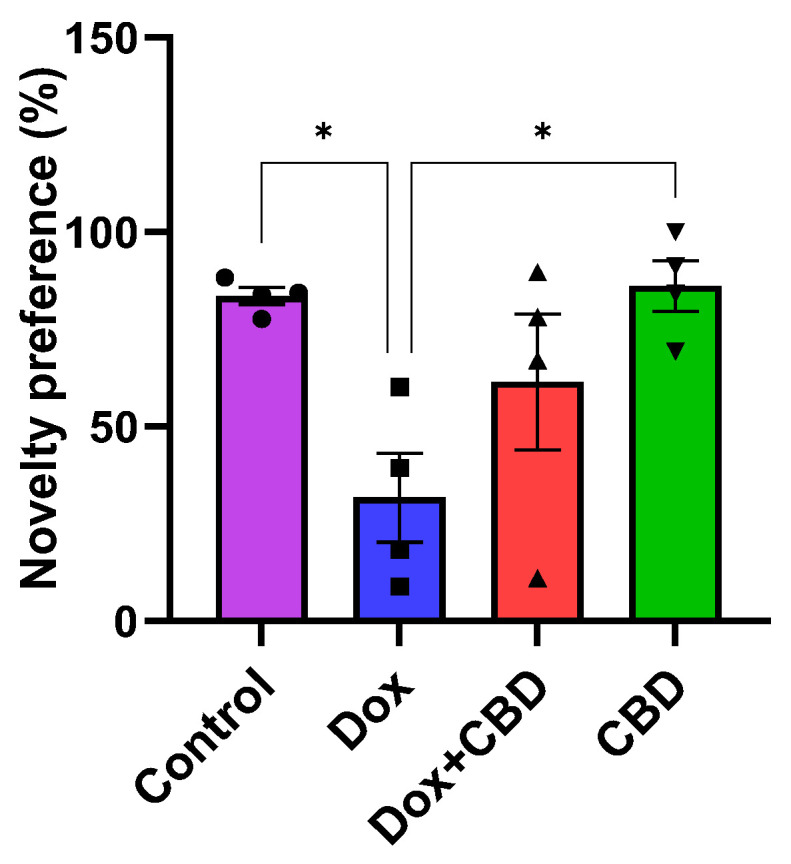
The percentage of preference for a novel object during the Novel Object Recognition test. The percentage of novel object preference was calculated as novel object exploration time/Total (novel + familiar) object exploration time × 100%. Data are presented as mean ± SEM (n = 4). * p ≤ 0.05 (one-way ANOVA followed by Tukey’s post hoc test). DOX—doxorubicin; CBD—Cannabidiol. Some error bars may be too small to see on the chart.