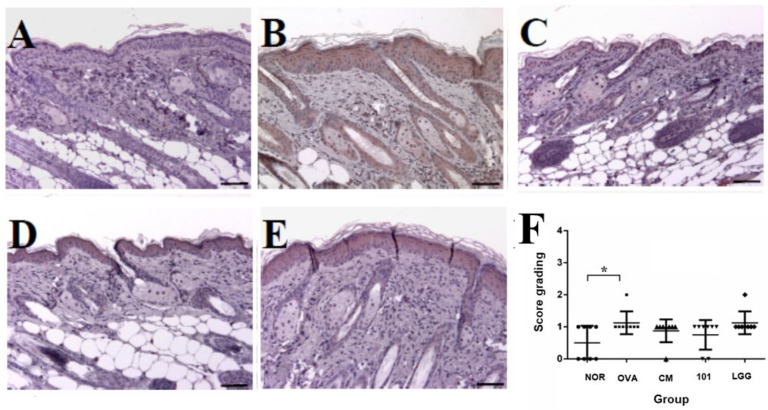
Figure 5.
Representative images of TSLP expression in sensitized skin sites of mice. Skin sections were stained using immunohistochemistry for TSLP. Images are shown for the (A) NOR group, (B) OVA group, (C) CM group, (D) NTU 101 group, and (E) LGG group, and (F) results of scoring in each group, examined at an original magnification of 100×. Each value is expressed as mean ± SD (n = 8). Statistical comparison of differences between each group and the OVA group (*: p < 0.05). The NOR group (control) received saline and a standard diet. The OVA group underwent sensitization and skin irritation with ovalbumin (OVA) on a normal diet. The CM group had the same OVA treatment plus prednisolone. The NTU 101 group received OVA treatment and NTU 101 at 1 × 10¹¹ CFU/day. The LGG group underwent OVA treatment and received L. rhamnosus GG ATCC 53103 at 1 × 10¹¹ CFU/day.

