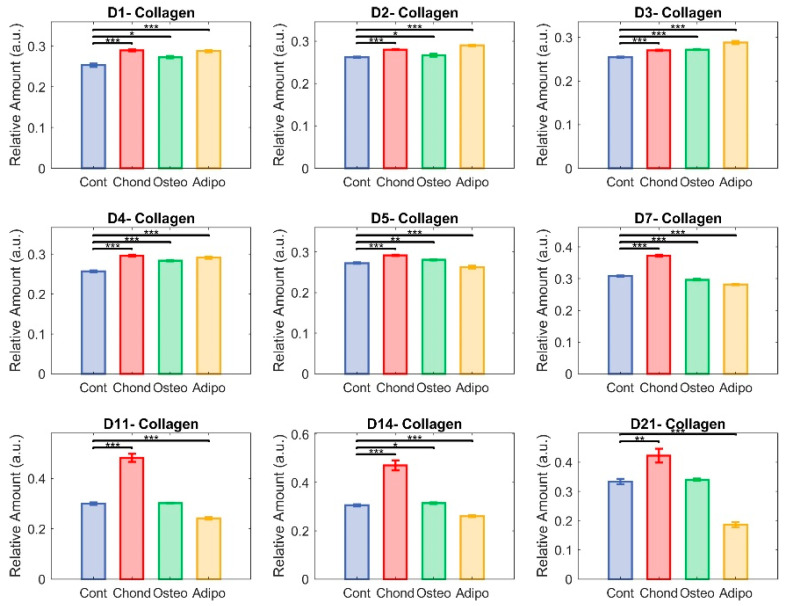
Figure 6.
Unmixed collagen. Here, each group—control (in blue), chondrocytes (in red), osteocytes (in green), and adipocytes (in yellow)—is represented with respect to their relative content of collagen. The non-parametric Mann–Whitney U test was used to assess significance (* p < 0.05, ** p < 0.01, and *** p < 0.001) among groups.

