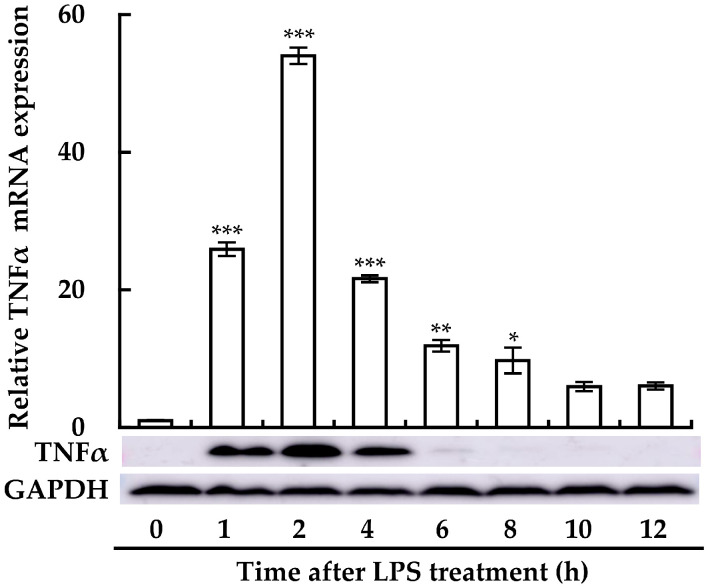
Figure 1.
Time-dependent effect of LPS on TNFα production in RAW264.7 cells. TNFα expression was measured at the mRNA level (upper panel) via RT-qPCR and at the protein level (lower panel) through immunoblotting, following treatment with 1 μg/mL LPS at various time points (0–12 h). Data from qPCR analyses are expressed as mean ± SE (n = 3). * p < 0.05, ** p < 0.01, and *** p < 0.001 vs. without LPS treatment (0 time). For the immunoblotting, one representative result from three independent experiments is shown. GAPDH was used as a loading control.

