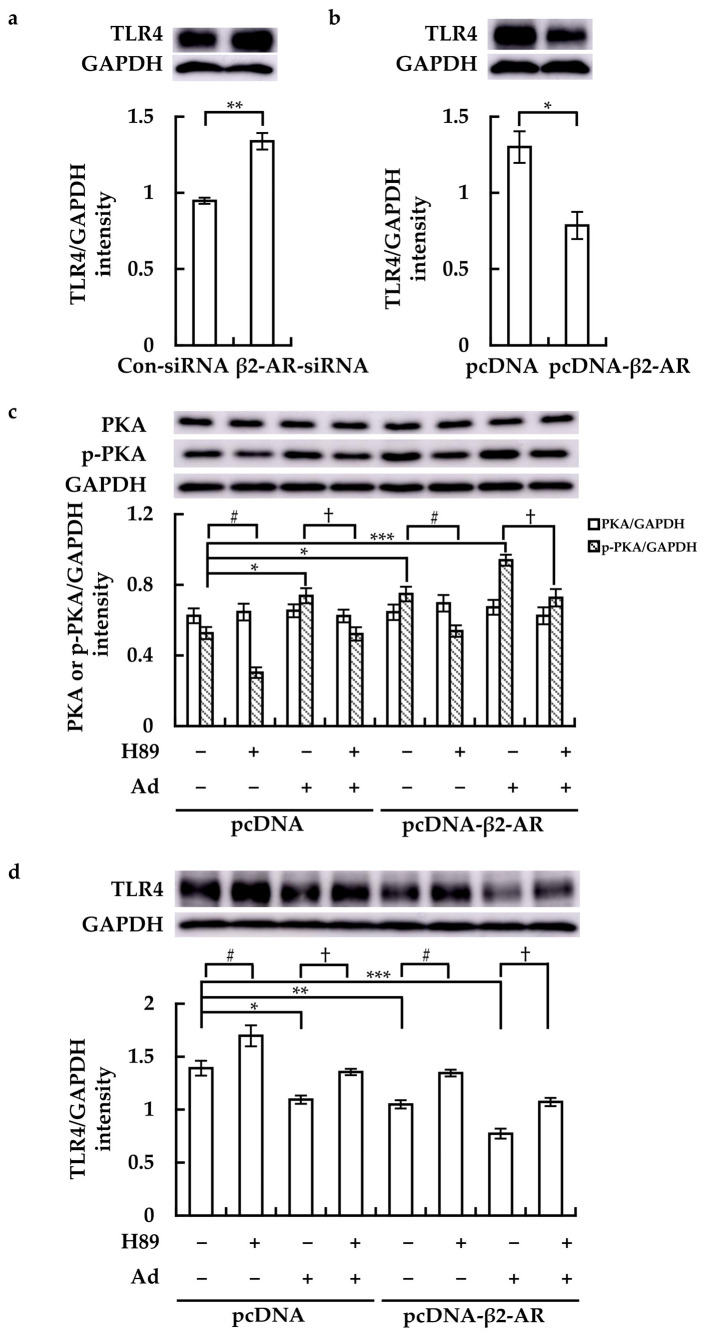
Figure 5.
Roles of β2-AR activation in PKA phosphorylation (p-PKA) and TLR4 expression in RAW264.7 cells. (a,b) Cells were transfected as described above, and TLR4 protein levels were assessed. After transfection with pcDNA or pcDNA-β2-AR for 8 h, H89 was added and incubated for 10 h. Ad was then added and incubated for 2 h. PKA, p-PKA, and TLR4 protein levels were detected (upper panel in (c,d)). One representative result from three independent experiments is shown. GAPDH was used as a loading control. Band density was quantitatively analyzed using ImageJ software, and the results (lower panel) are expressed as means ± SE (n = 3). * p < 0.05, ** p < 0.01, and *** p < 0.001; # p < 0.05; † p < 0.05.

