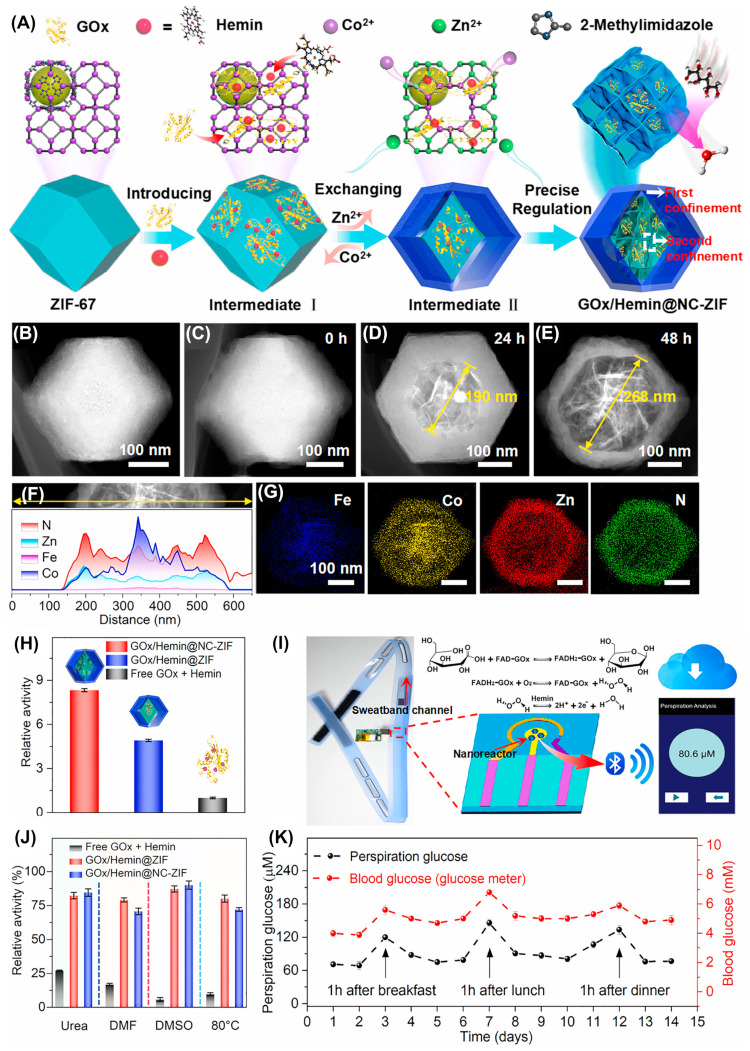
Figure 5.
(A) Graphical representation for the stepwise synthesis of GOx/Hemin@NC-ZIF. (B–E) TEM images at different etching times. (F) HAADF and its EDS line scan. (G) EDS mappings for various elements. (H) Relative activities of different electrocatalysts. (I) Photograph of wearable sweatband and its catalytic mechanism toward glucose oxidation along with perspiration analysis on a smartphone display. (J) Relative activities of different electrocatalysts in various reaction conditions. (K) Glucose concentration obtained through perspiration and blood of a human within 14 days. Reproduced with permission from [70].

