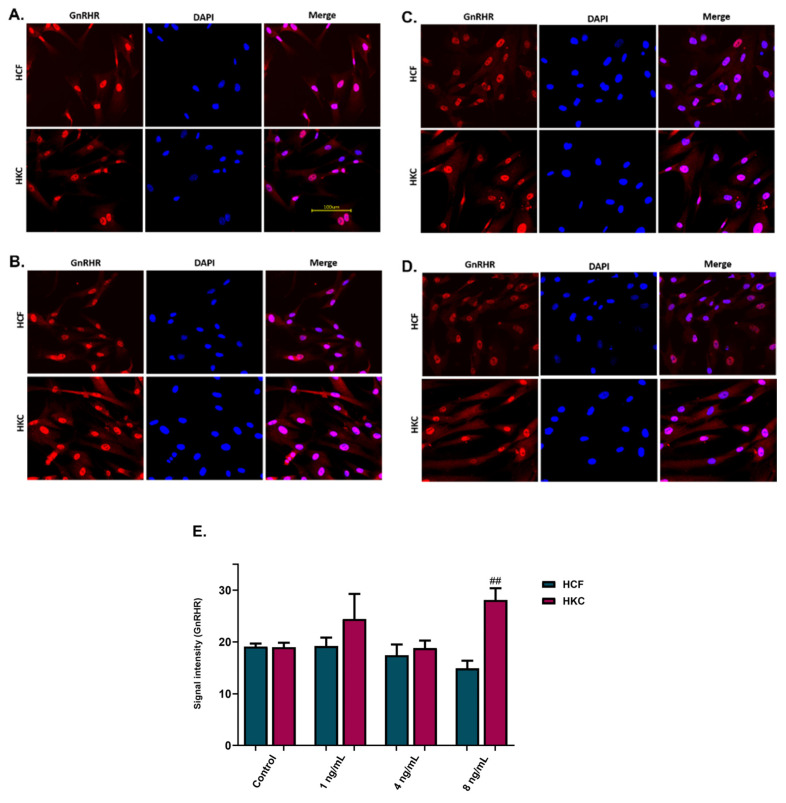
Figure 4.
Immunofluorescence images and analysis for gonadotropin-releasing hormone receptor (GnRHR) expression in 2D GnRH stimulation of HCFs and HKCs. (A) The controls were not stimulated with GnRH; (B) 1 ng/mL; (C) 4 ng/mL; (D) 8 ng/mL; (E) immunofluorescence images’ signal intensity for GnRHR expression. Statistical significance between HCFs and HKCs within the dose determined by an unpaired t-test with Welch’s correction. Significance indicated as ## p < 0.01.

