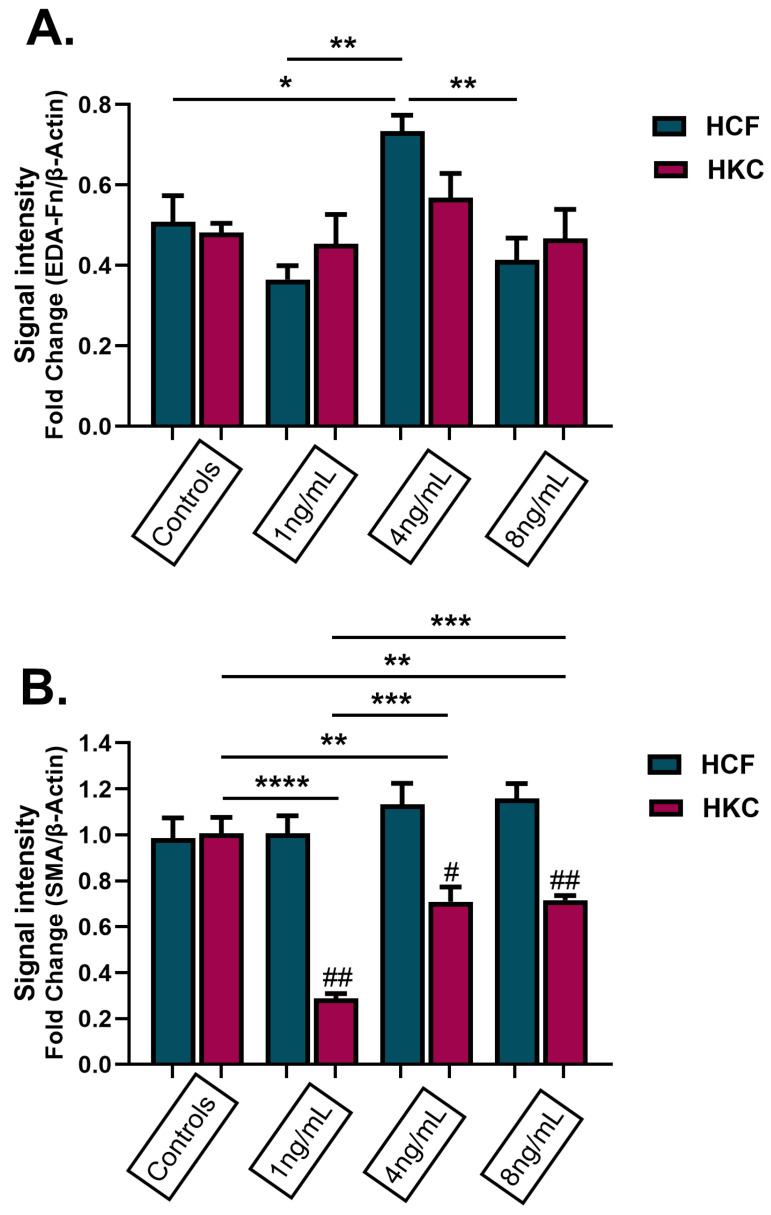
Figure 6.
Protein expression of fibronectin and α-smooth muscle actin (SMA) in 3D HCFs and HKCs following stimulation with 1 ng/mL, 4 ng/mL, and 8 ng/mL GnRH for 4 weeks. (A) Results of EDA-Fn protein expression in HCFs and HKCs stimulated with GnRH. (B) Results of SMA protein expression in HCFs and HKCs stimulated with GnRH. Statistical significance based on a one-way ANOVA with Šídák’s multiple comparisons test. Post hoc significance indicated as * p < 0.05, ** p < 0.01, *** p < 0.001, **** p < 0.0001. Statistical significance between HCFs and HKCs within the dose determined by the unpaired t-test with Welch’s correction. Significance indicated as # p < 0.05, ## p < 0.01.

